
OpsWorker started with a single, focused job: when an alert fires, investigate automatically and surface root cause in Slack before a human has finished reading the notification. That job remains at the core of what we do.
v1.6.0 expands the perimeter. You can now start investigations on demand - no alert required. You can ask your cluster questions in plain language and get answers grounded in live metrics. And a new Resource Optimizer agent analyzes your actual workload behavior and tells you exactly where your CPU and memory settings are wrong, along with the manifest snippet to fix them.
Here is what shipped.
Resource Optimizer - right-size your workloads against real usage
Over-provisioning Kubernetes workloads is one of those problems that quietly compounds. You set generous CPU and memory requests during a stressful deployment, you never revisit them, and six months later you are running at 12% average utilization while paying for 100%. Under-provisioning is the other failure mode - throttled CPUs causing latency spikes that look like application bugs until someone runs kubectl top.
AI based Special Agent for Kubernetes Resource Optimizer
The Resource Optimizer is a new AI agent that closes this loop. It analyzes your live workloads against real usage metrics and produces goal-driven recommendations. Tell it whether you are optimizing for cost, for performance, or for a balance between the two - the analysis adapts accordingly.
A few design decisions worth knowing:
- No CPU limits. The optimizer will never recommend setting a CPU limit, because CPU limits cause throttling. This is intentional and non-negotiable.
- Workload-aware scaling strategy. Recommendations account for whether a workload is a Deployment, StatefulSet, or Job. A stateful service and a stateless API have different autoscaling constraints, and the optimizer understands that.
- Ready-to-apply snippets. Every recommendation comes with a concrete manifest you can copy directly into your repo.
- Full transparency. Each run produces a visual trace diagram and a complete call log showing exactly which data the agent examined and how it reached its conclusion.
Use cases:
- Your team is preparing for a cost review and needs to identify over-provisioned workloads across a multi-namespace production cluster. Run the optimizer with the cost goal selected - it surfaces the largest gaps, sorted by estimated savings, with ready-to-apply manifests.
- A new microservice was deployed with copy-pasted resource settings from a different service. After a week of production traffic, run the optimizer to replace the guesswork with settings tuned to actual usage.
- Before scaling from one cluster to three, you want to understand your current resource efficiency baseline. The optimizer gives you a workload-by-workload picture with recommended autoscaling strategy per service.
Start investigations on demand
Until now, OpsWorker investigations started when an alert fired. That was a deliberate constraint - it kept the scope tight and the signal-to-noise ratio high.
The constraint stays in place. Alert-triggered investigations remain the primary workflow and they are unchanged.
But there is a legitimate class of problem that does not produce an alert: the slow memory leak you noticed in a dashboard, the deployment that succeeded but is behaving differently than expected, the suspicion that something is wrong before your thresholds trigger. For those situations, v1.6.0 adds a "Start Investigation" button and modal. Write a plain-text description of the problem. OpsWorker investigates.
Manually triggered investigations are clearly marked with a "Manual" badge so they stay distinct from alert-triggered ones in your history.
Use cases:
- You notice CPU usage climbing on a StatefulSet over 48 hours but it has not crossed the alert threshold yet. You describe the pattern in plain text and start an investigation to get ahead of the incident.
- After a deployment, a service passes health checks but response times feel slower. No alert fires. You trigger a manual investigation to correlate the behavior with the change.
- During a production review meeting, someone asks whether a workload is behaving as expected. You start an investigation on the spot, directly from the description of the concern.
AI SRE Chat - talk to your clusters
This is the feature that required the most deliberate scope control, because the worst version of it would have been a Kubernetes chatbot that sounds confident and gets things wrong.
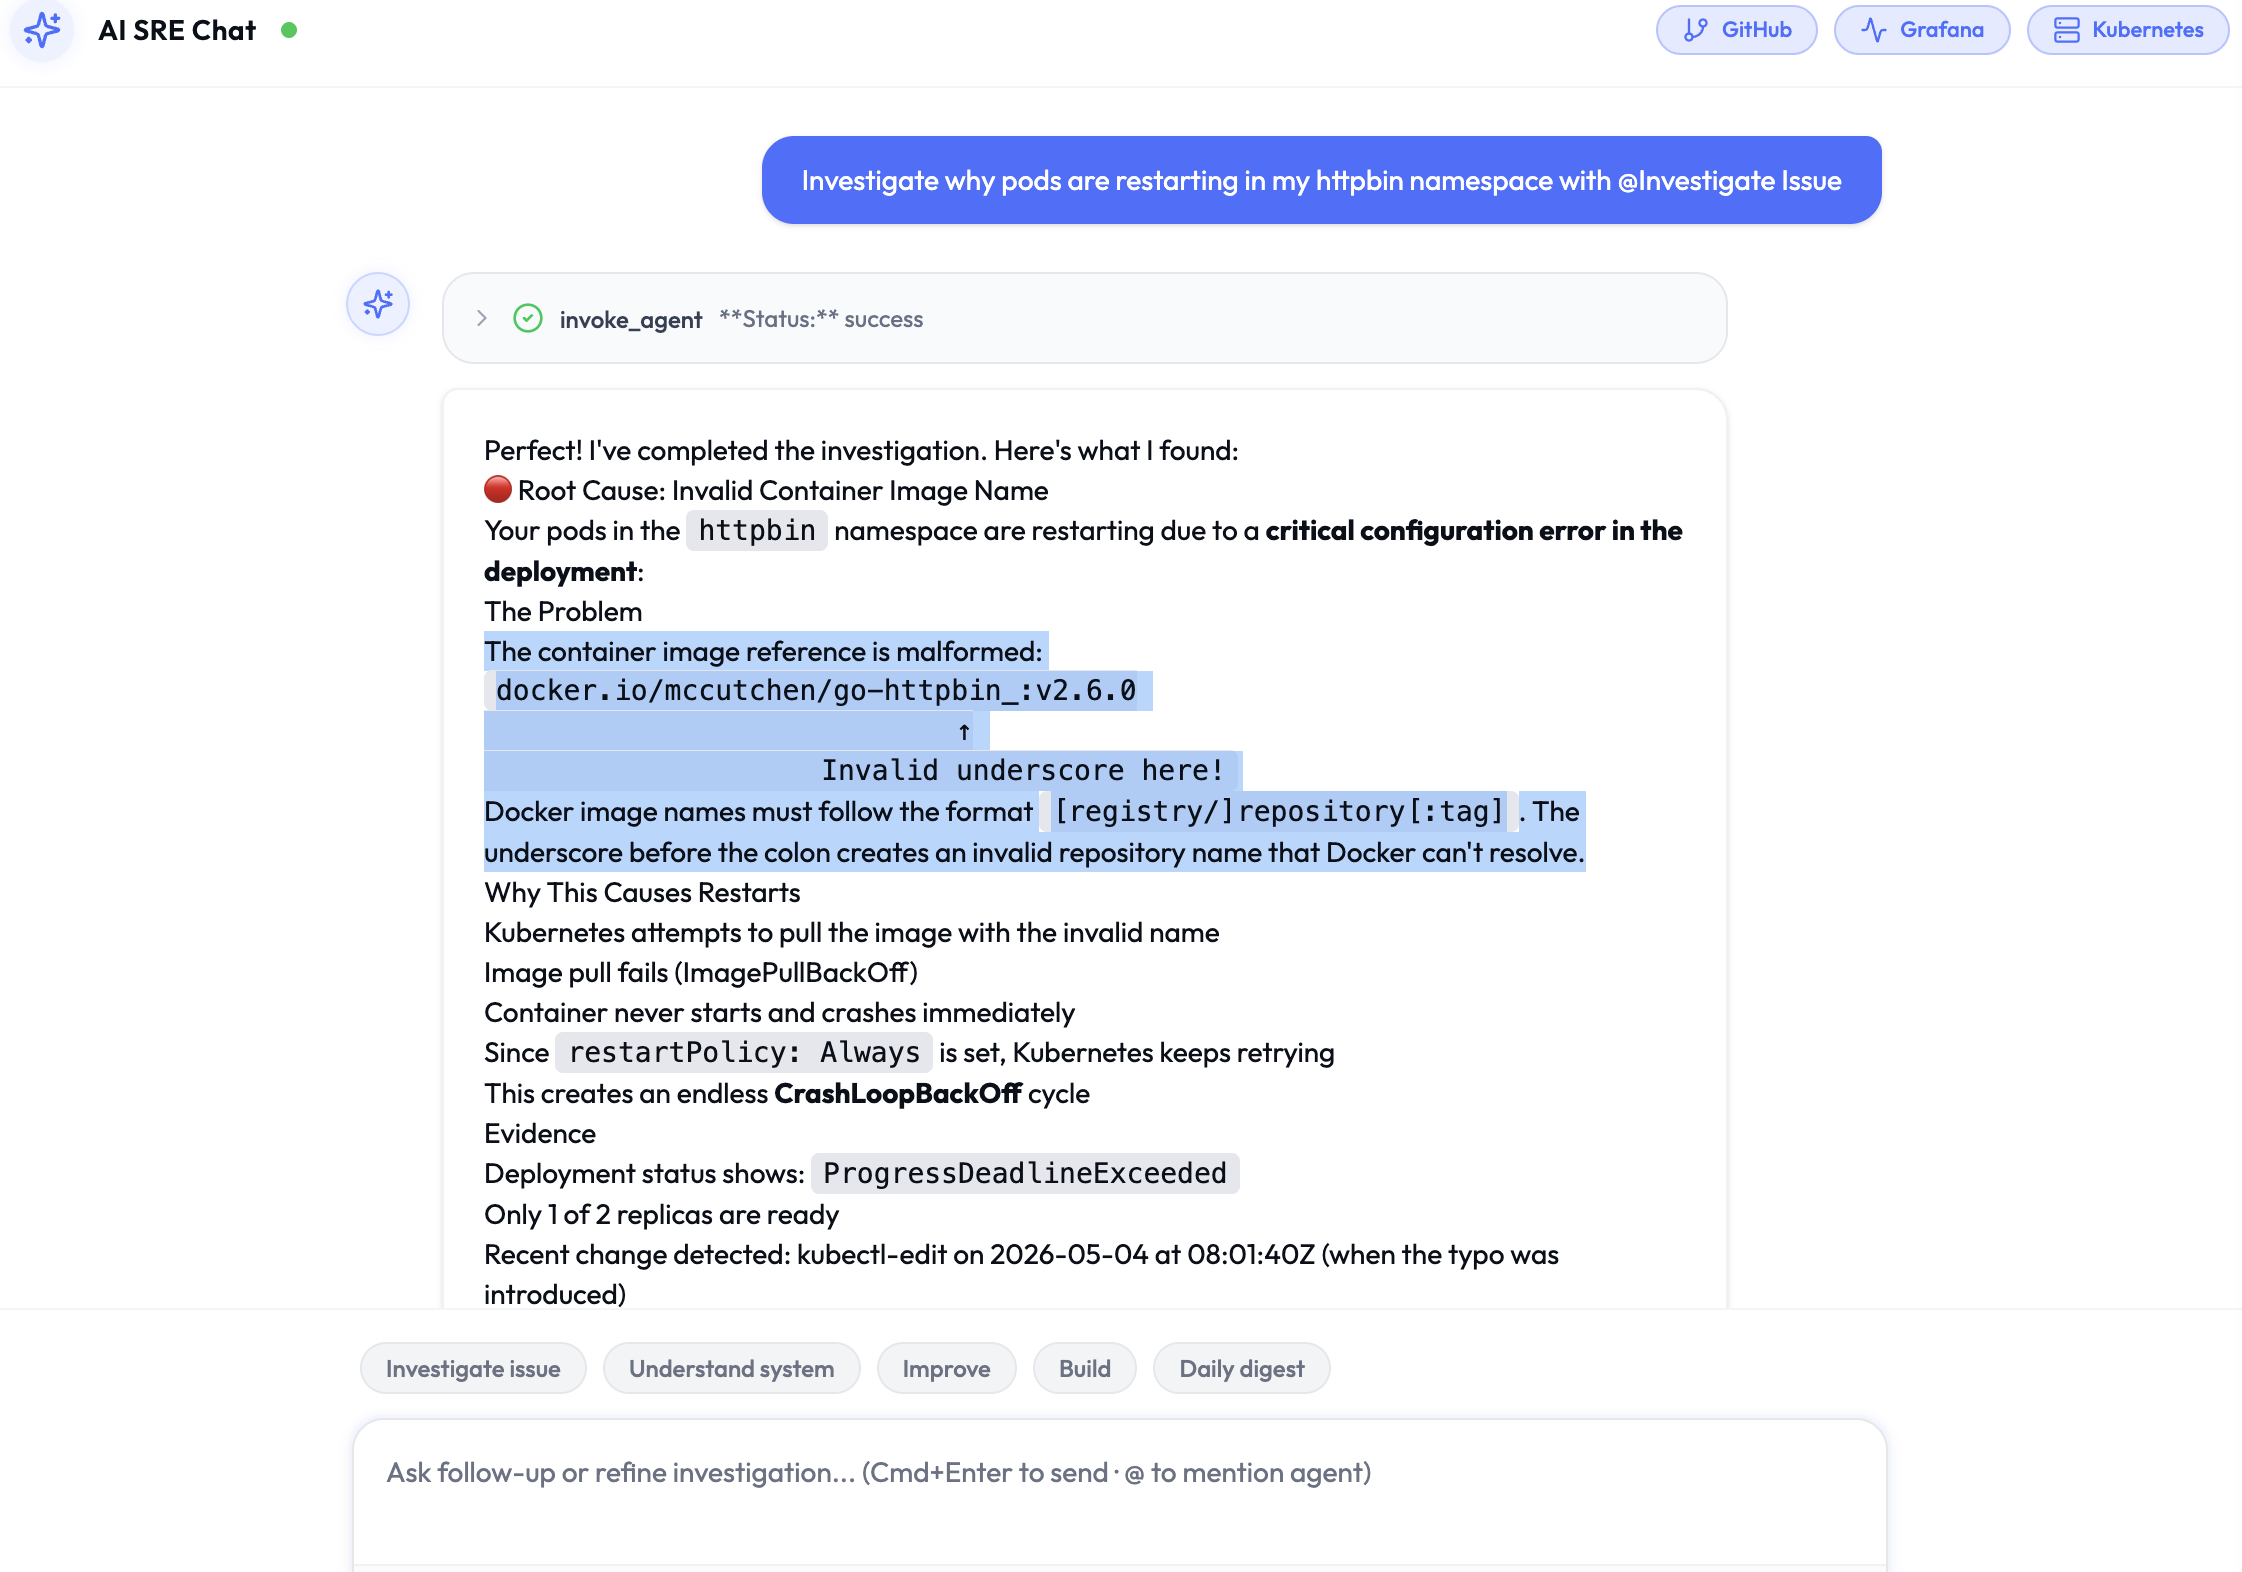
The version we shipped is grounded. AI SRE Chat lets you explore and troubleshoot your Kubernetes environment through a conversational interface, but every response is backed by live cluster state continuously synced by OpsWorker. You are not asking a language model what it knows about Kubernetes - you are querying your actual environment through a natural language interface.
Practical details:
- @-mention to focus. Reference specific namespaces, services, deployments, and jobs to anchor the conversation to the right scope.
- Inline metric charts. PromQL line charts and optimizer trace diagrams render directly in the chat without switching tools.
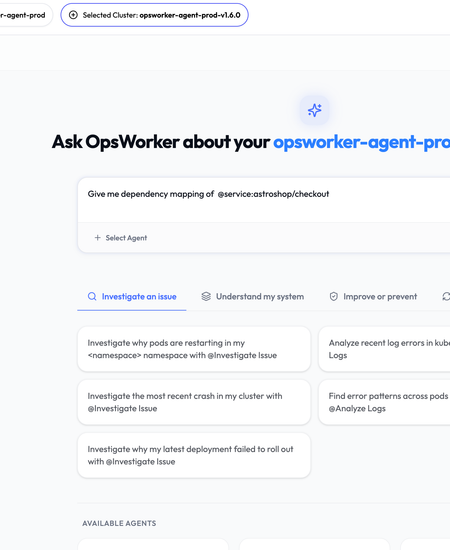
- Starter prompts. The interface surfaces suggested questions based on what is connected, so there is no blank-page problem.
Use cases:
- You want dependency mapping for a specific service. You type
give me dependency mapping of @payment-serviceand get a visual map of what that service depends on and what depends on it. - During an incident, you ask the chat to show CPU and memory trends for
@api-gatewayover the last 2 hours. The chart renders inline, you stay in the investigation context. - A new engineer joins the team and wants to understand what is running in
@production. The chat gives them a structured, queryable overview without requiring them to know the right kubectl commands.
New and expanded integrations
GitLab and GitHub both now support full OAuth connections (with PKCE/DCR flow), giving the optimizer and investigation agents the ability to read your repositories and correlate incidents with recent changes. This is the same change correlation that was previously GitHub-only, extended to teams running on GitLab.
Datadog is now a first-class alert source. Previously Datadog users had to route alerts through intermediary tooling. In v1.6.0, you install the Datadog integration through a guided modal and alerts flow directly into OpsWorker.
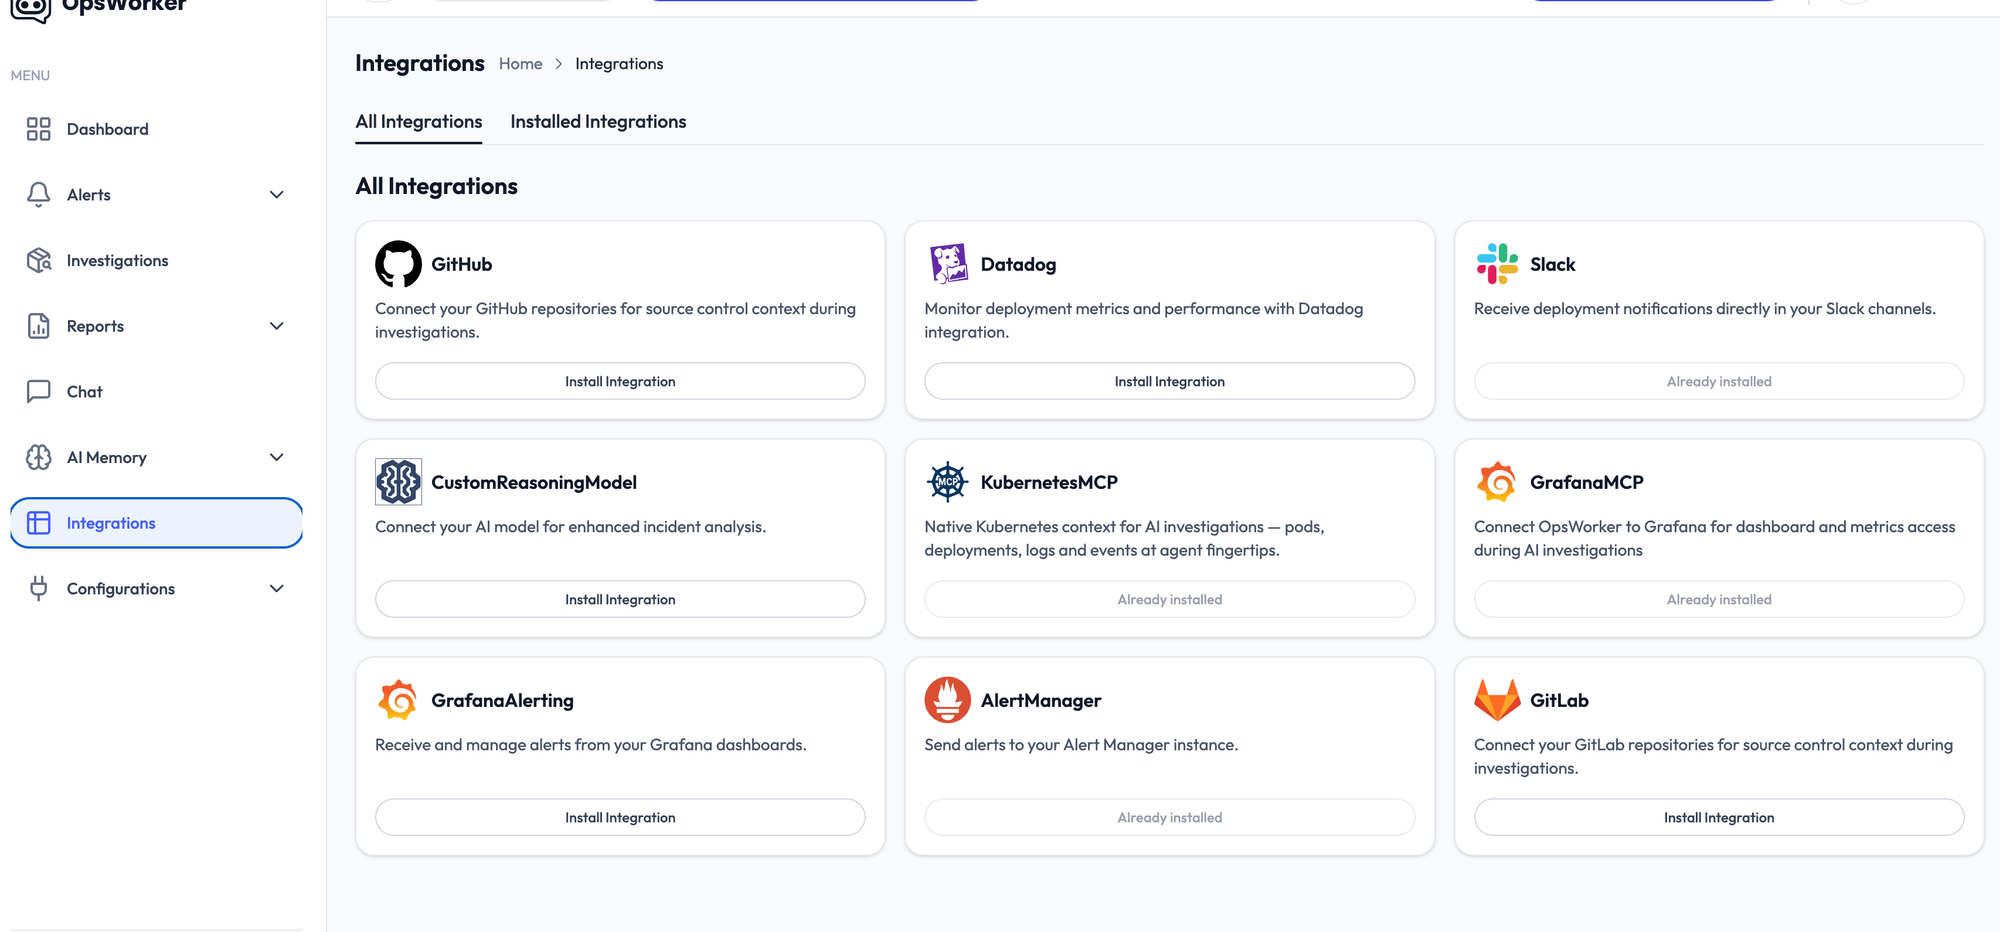
Integrations now carry capability descriptions in the UI. When you connect something, the interface tells you what it unlocks - which agents become available, which investigation capabilities it enables. The available agents are determined automatically based on what is connected.
Use cases:
- Your team runs GitLab for source control. You connect OpsWorker via OAuth. When an alert fires, the investigation automatically checks recent merge requests in the affected service's repository as part of the root cause analysis.
- You use Datadog for monitoring. You install the Datadog integration and your existing Datadog alerts start feeding into OpsWorker investigations without reconfiguring alert routing.
- A new engineer asks which OpsWorker capabilities are available. Instead of checking documentation, they look at the integrations panel - it shows exactly what each connection enables.
Memory - OpsWorker now retains context
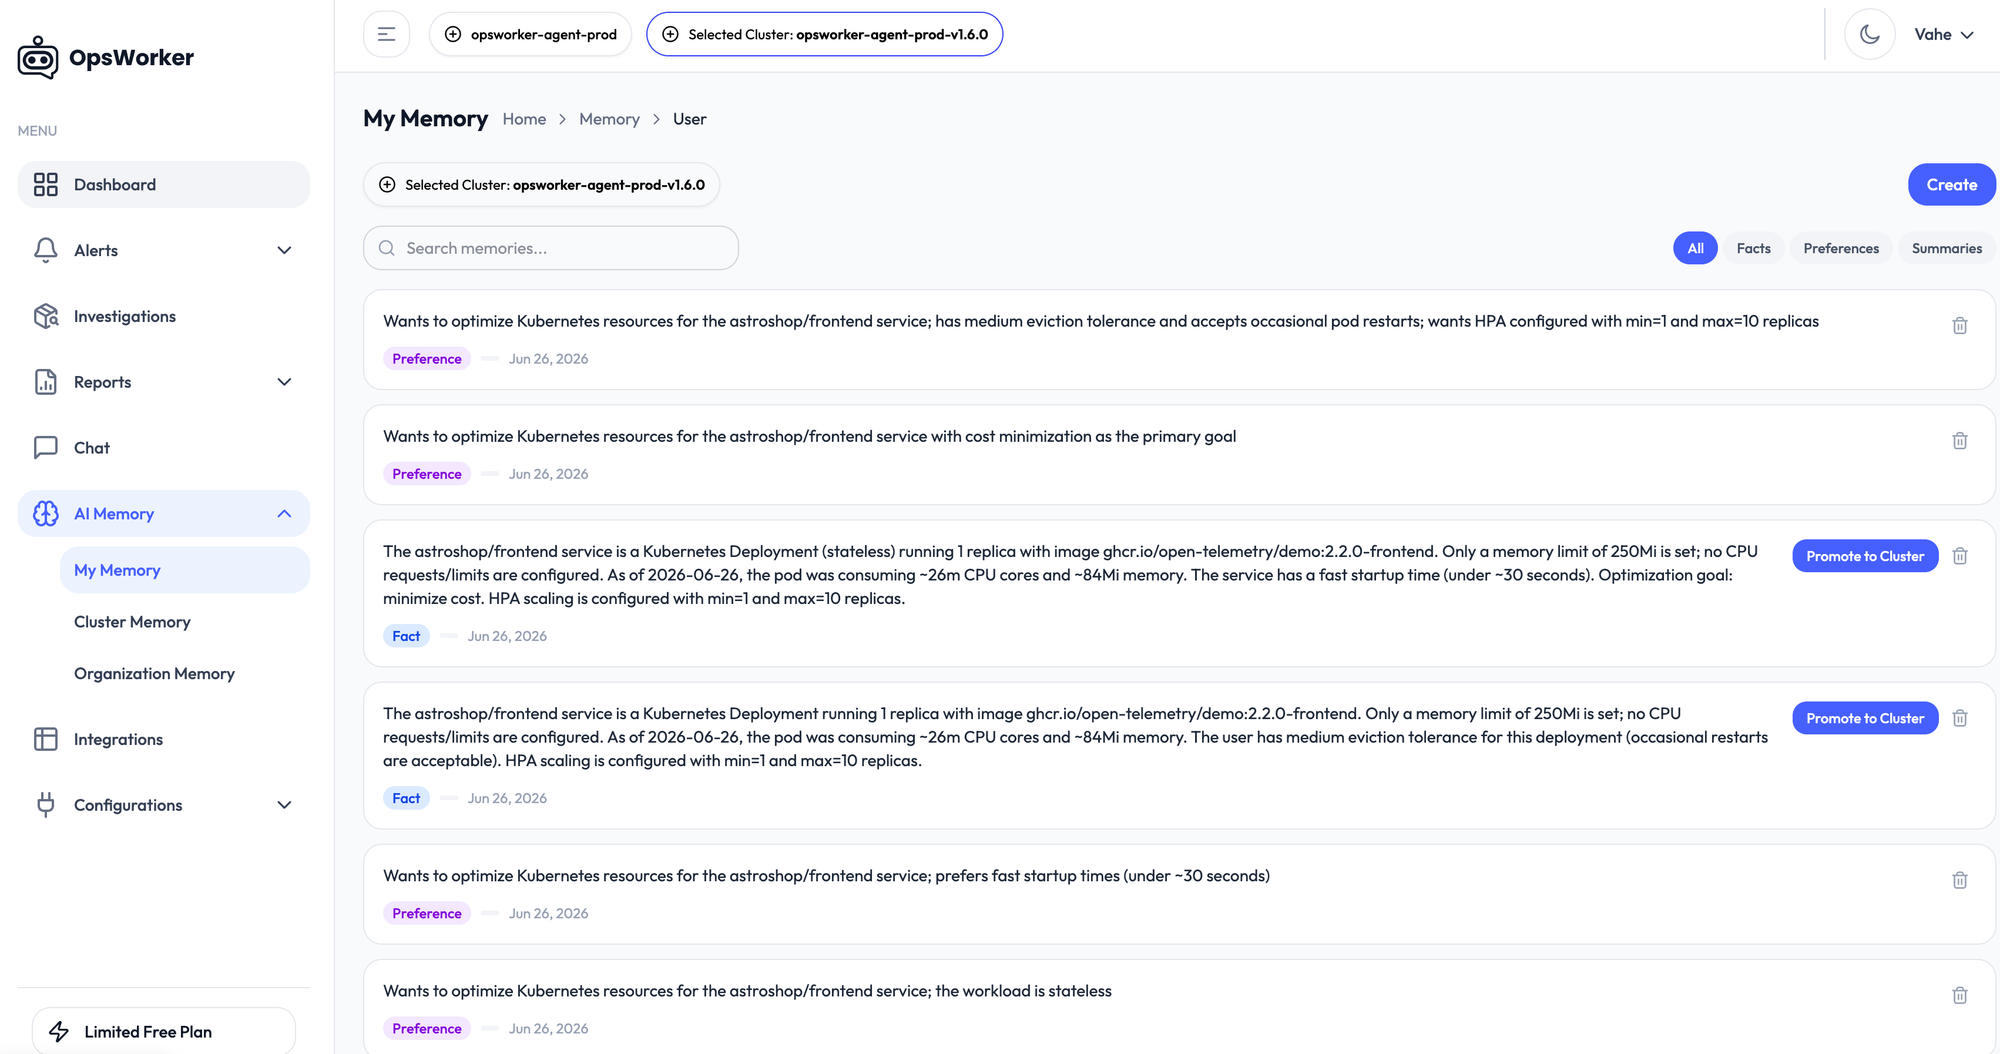
When you connect GitHub or GitLab, OpsWorker begins building memory from what it reads: repository structure, service ownership, deployment patterns, team context. This memory enriches subsequent investigations - reducing the setup context that had to be re-established with each session.
This is an early capability. It will deepen as more integrations contribute to the memory layer.
Use cases:
- A service has entered CrashLoopBackOff three times over two months. Each time, the on-call engineer has investigated from scratch - pulling logs, checking resource limits, correlating with recent deployments. When OpsWorker investigates the third occurrence, memory surfaces what the first two investigations found: the same container OOM pattern, the same time-of-day traffic spike, the same root cause. The investigation output says so explicitly. The team now has the context to fix the underlying cause, not just the symptom.
- A platform team supports 12 development teams running on shared clusters. Over time they accumulate knowledge that lives nowhere permanent: which services have known noisy alert patterns, which deployments historically cause cascade failures in adjacent namespaces, which teams run non-standard resource configurations and why. When that knowledge exists only in people's heads, every new incident becomes a support ticket to the platform team. Memory gives OpsWorker that institutional knowledge in structured form - taught once, applied automatically in every subsequent investigation for that cluster.
- A new backend engineer joins and gets added to the on-call rotation after two weeks. Their first incident is a service degradation in a service they have never touched. Without memory, the first 20 minutes go toward establishing context that experienced team members would have immediately: what this service does, what its dependencies are, what its failure patterns look like. With memory, OpsWorker's investigation output already contains that context - ownership, known quirks, past failure patterns - derived from prior investigations. The new engineer spends their time on the actual problem.
Demo mode and easier onboarding
We added a guided demo experience for prospective users. The demo runs against real Kubernetes clusters with rate-limited access, so you see actual behavior - real investigations, real optimizer runs, real chat responses - not a scripted walkthrough.
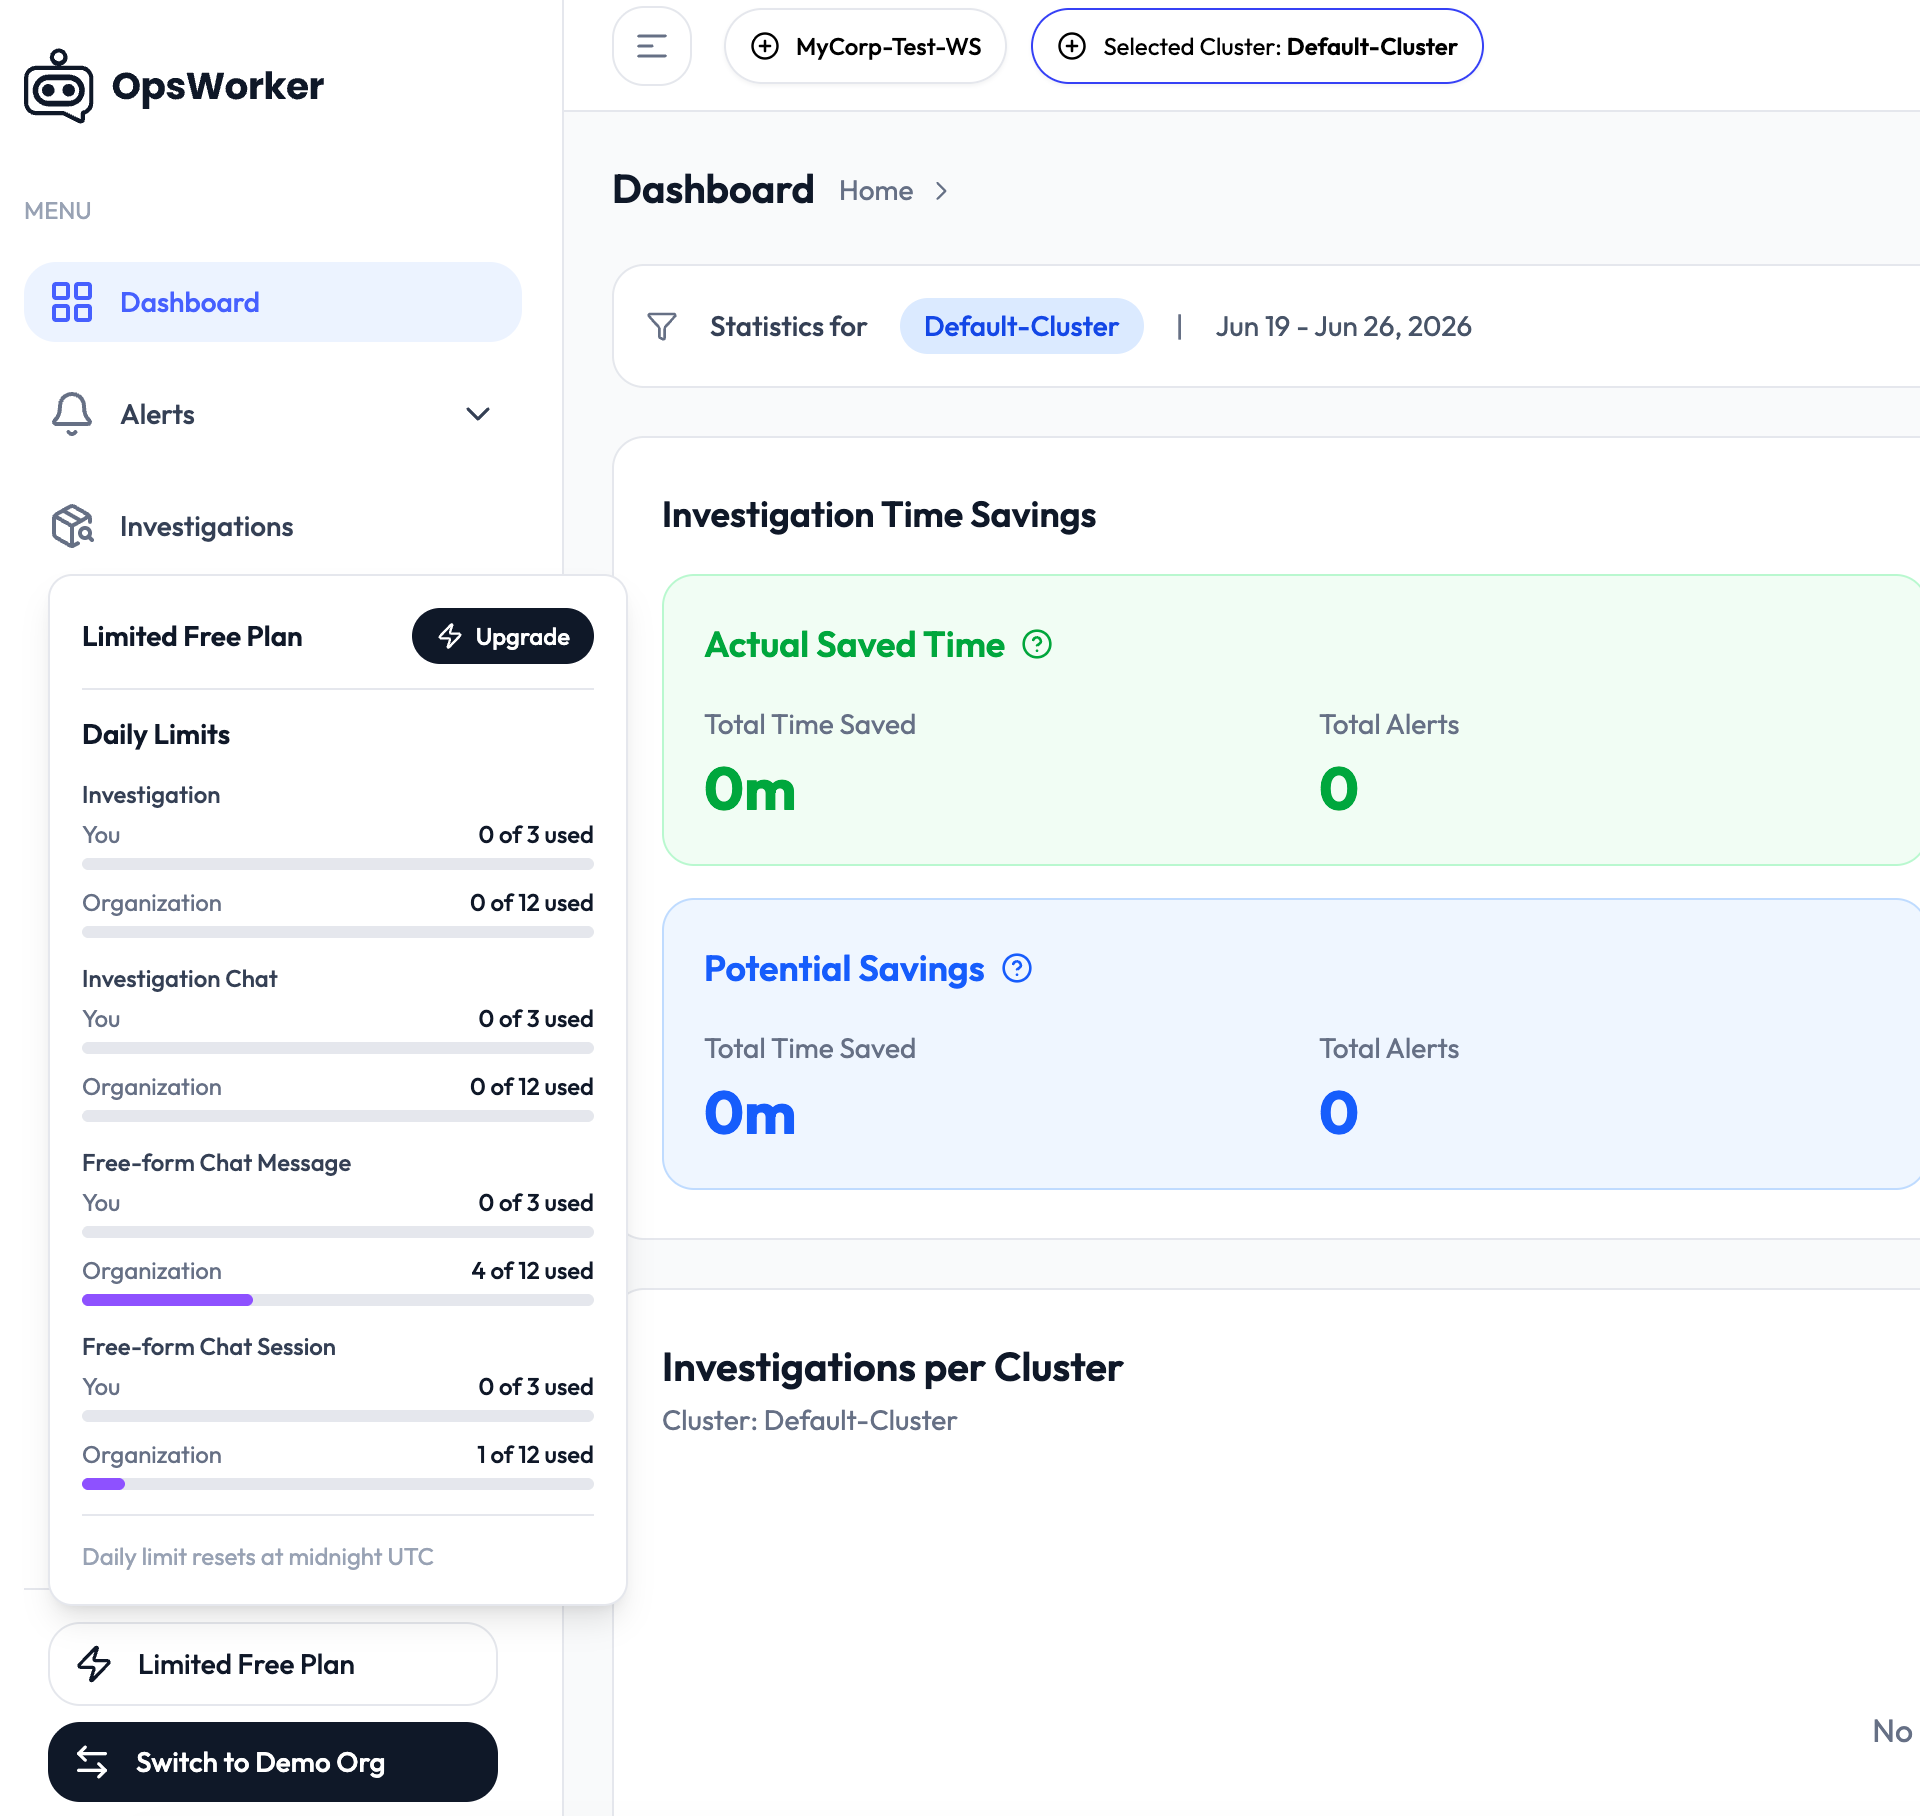
Beyond the demo, onboarding is now open to anyone who wants to try OpsWorker against their own test environment. The path is:
- Sign in
- Install the Helm chart on your Kubernetes cluster
- Start investigating
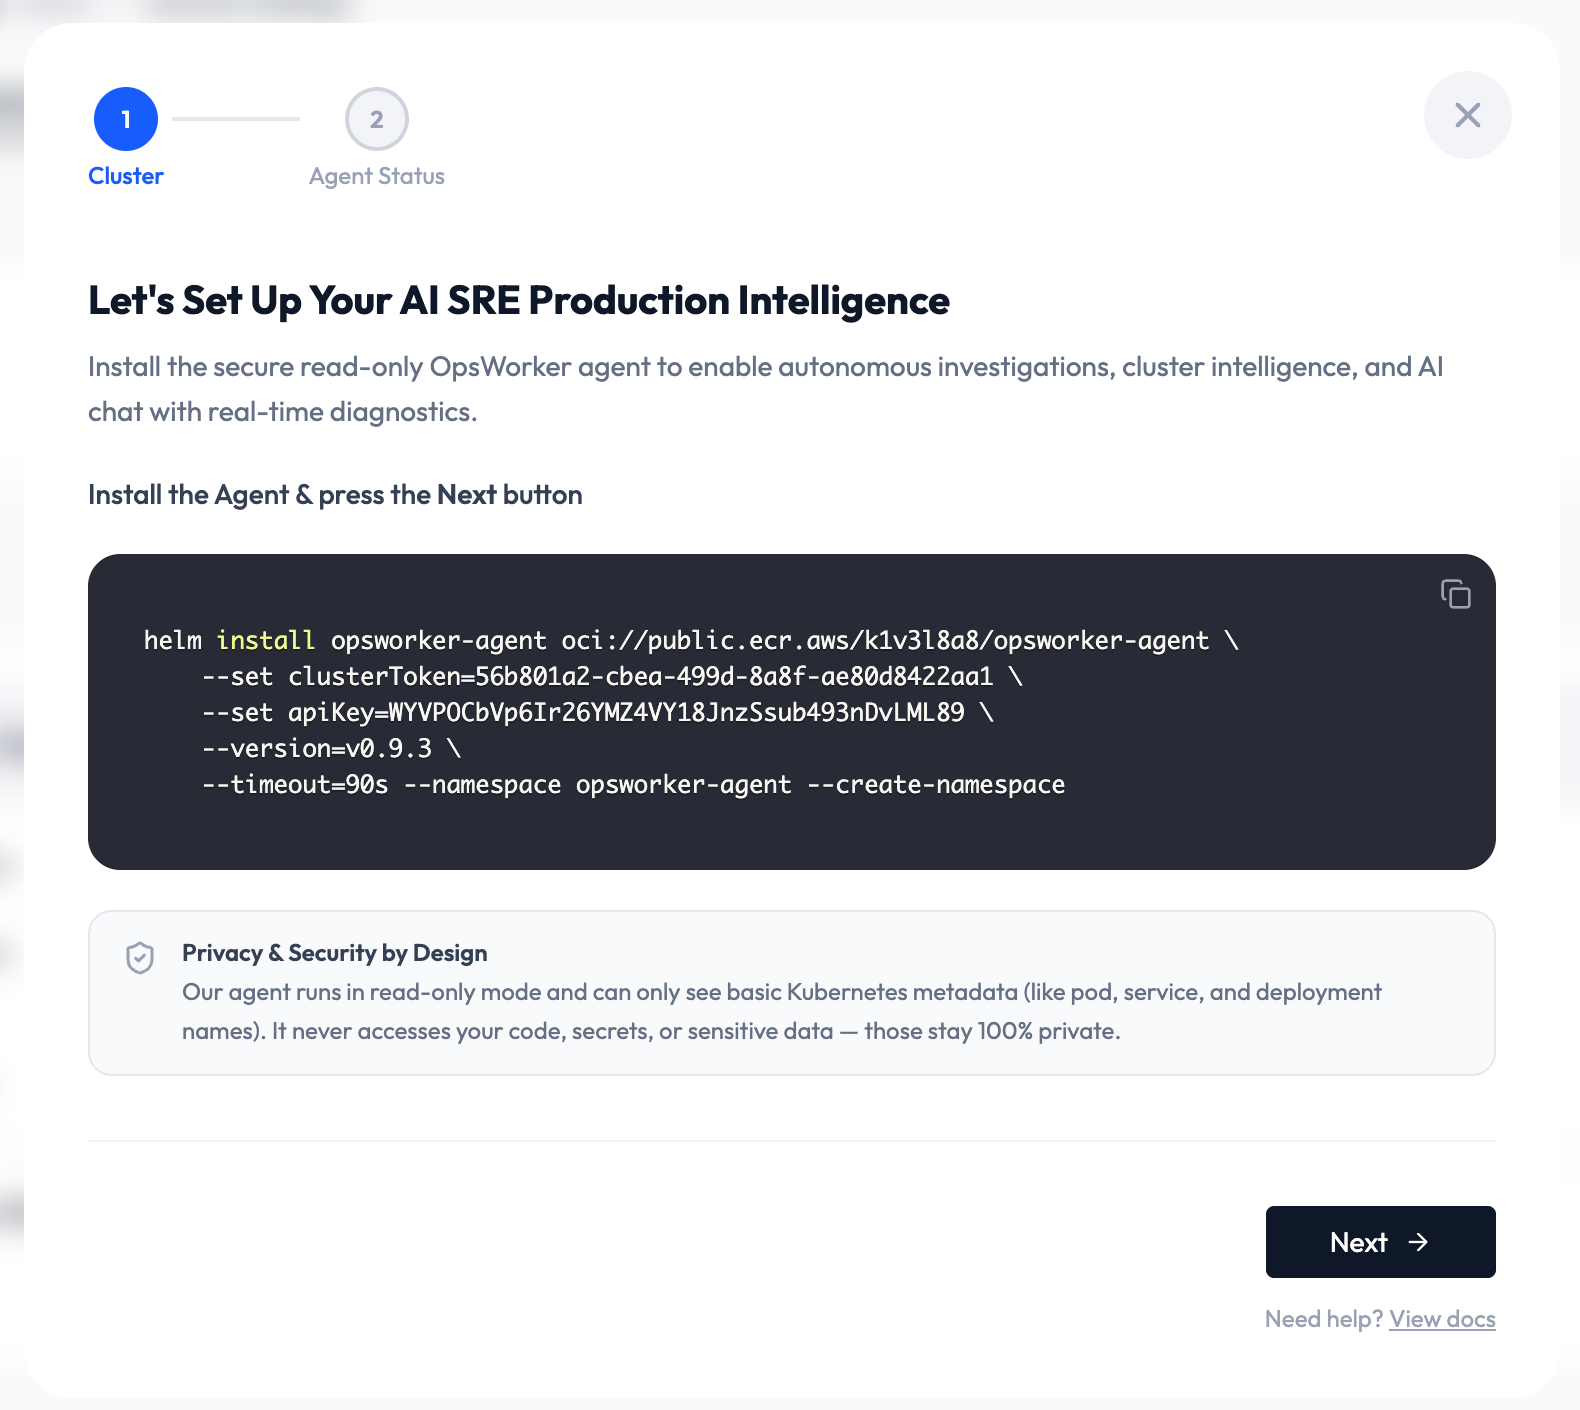
The Helm chart installs a read-only, outbound-only in-cluster agent. Nothing in your cluster is modified. Investigation, optimizer, and chat capabilities are all available from the first run.
Organization-level usage limits for investigations and chat sessions are enforced with clear in-app messaging when a limit is reached and a direct path to upgrading.
Under the hood
Cluster state - namespaces, services, deployments, jobs - is now continuously synced rather than queried on demand. This makes investigations faster and means the chat interface is always working from current data rather than stale snapshots.
The investigation and optimizer pipelines both received significant observability improvements: structured logging throughout, better tracing, and a cleaner separation between the alert ingestion path and the investigation execution path. The backend refactoring reduces alert query latency and improves dashboard read performance.
Summary
v1.6.0 adds three new investigation surfaces - on-demand investigations, conversational cluster exploration, and proactive resource analysis - while keeping the original alert investigation workflow unchanged. The integrations expand to GitLab and native Datadog alert ingestion. Onboarding is simpler and open.
The reactive, sub-2-minute Slack investigation is still what OpsWorker does. v1.6.0 is what happens around it.
Subscribe to our email newsletter and unlock access to members-only content and exclusive updates.
Comments