Modern systems rarely fail in simple ways. When something breaks, it’s usually the result of a chain reaction: a configuration change here, a dependency slowdown there, a resource limit quietly reached somewhere deep in the stack. For Site Reliability Engineers, the real challenge is no longer detecting incidents — it’s understanding and resolving them fast enough.
This is where AI SRE Agents are starting to change how reliability engineering works.
In this article, we’ll break down:
- What an AI SRE Agent actually is
- How it works behind the scenes
- Real-world AI SRE use cases
- And how to implement one in a modern DevOps environment
This is a practical guide — not theory.
What Is an AI SRE Agent?
An AI SRE Agent is a software agent that acts like an autonomous reliability engineer. Instead of just sending alerts or dashboards, it actively investigates incidents, correlates signals, identifies root causes, and recommends or executes remediation steps.
Unlike traditional SRE tools, an AI SRE Agent:
- Understands system context (infrastructure, services, dependencies)
- Reasons across logs, metrics, traces, configs, and code
- Operates continuously, not only during incidents
- Learns from past incidents and operational patterns
In simple terms:
An AI SRE Agent doesn’t tell you that something is broken — it tells you why and what to do next.
AI SRE Agent vs Traditional SRE Automation
Traditional SRE automation focuses on predefined rules:
- “If CPU > 80%, scale”
- “If pod crashes, restart”
- “If alert fires, notify on-call”
An AI SRE Agent goes further.
| Traditional Automation | AI SRE Agent |
|---|---|
| Rule-based | Reasoning-based |
| Reactive | Proactive + Reactive |
| Alert-centric | Incident-centric |
| Isolated signals | Cross-signal correlation |
| Human-driven investigation | Autonomous investigation |
This shift matters because modern cloud-native systems (Kubernetes, microservices, service meshes) generate too much operational data for humans to process in real time.
How an AI SRE Agent Works
While implementations vary, most AI SRE Agents follow a similar lifecycle.
1. Alert or Signal Ingestion
The agent consumes signals from:
- Monitoring systems (Prometheus, CloudWatch, Datadog)
- Alert managers
- Logs, metrics, traces (OpenTelemetry)
- CI/CD and deployment events
- Kubernetes API and cloud APIs
Importantly, alerts are just entry points, not conclusions.
2. System Context Discovery
Instead of analyzing alerts in isolation, the AI SRE Agent builds a live model of the system:
- Kubernetes resources and ownership
- Service-to-service dependencies
- Infrastructure layers (nodes, clusters, cloud services)
- Databases, queues, external APIs
This topology awareness allows the agent to understand blast radius and hidden dependencies.
3. Automated Investigation
The agent then runs structured investigations:
- Correlates logs, metrics, and traces
- Compares current behavior with historical baselines
- Detects configuration drift or recent changes
- Identifies abnormal patterns (latency, error rates, resource pressure)
Instead of asking engineers to “dig through dashboards,” the agent does the digging itself.
4. Root Cause Analysis
Using reasoning and context, the AI SRE Agent narrows down:
- Primary root cause
- Contributing factors
- Secondary symptoms
For example:
“The checkout service latency increased due to connection pool exhaustion caused by a slow downstream database query introduced in the last deployment.”
This level of explanation is what makes AI SRE Agents fundamentally different from classic monitoring tools.
5. Remediation and Prevention
Depending on permissions and policy, the agent can:
- Suggest remediation steps (commands, config changes)
- Execute safe automated actions (scaling, rollbacks, restarts)
- Propose long-term preventive improvements
This turns incident response from a manual firefight into a repeatable, auditable process.
AI SRE Use Cases in Practice
1. Incident Response Automation
AI SRE Agents reduce MTTR by:
- Investigating incidents immediately
- Providing clear, actionable summaries
- Eliminating guesswork during on-call situations
Engineers spend less time reacting and more time improving systems.
2. Kubernetes Troubleshooting
In Kubernetes-heavy environments, AI SRE Agents can:
- Detect misconfigurations (limits, probes, autoscaling)
- Identify failing dependencies across namespaces
- Explain why pods are restarting, throttled, or stuck
This is especially valuable as cluster complexity grows.
3. Change Impact Analysis
By tracking deployments and config changes, AI SRE Agents can:
- Correlate incidents with recent releases
- Detect risky patterns early
- Warn about potential regressions before they escalate
This helps teams move faster without sacrificing reliability.
4. Knowledge Capture and Operational Learning
Every incident investigated by an AI SRE Agent becomes:
- Structured operational knowledge
- A reference for future incidents
- Training data for improving reliability practices
Over time, this reduces tribal knowledge and on-call burnout.
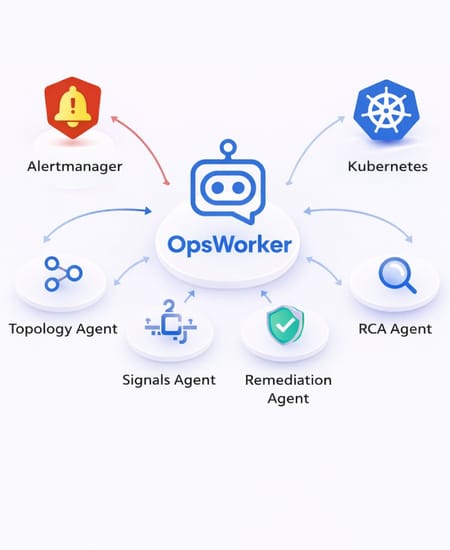
How We Implement an AI SRE Agent at OpsWorker.ai (Multi-Agent Logic)
When people hear “AI SRE Agent,” they often imagine one giant model doing everything. That’s not how we build it.
In OpsWorker.ai, we implement the AI SRE Agent as a multi-agent system: a set of specialized agents that collaborate on an incident like an experienced on-call team would. Each agent has a clear role, narrow responsibilities, and guardrails. The result is faster investigations, better explanations, and safer automation.
1) The Orchestrator Agent
This is the “incident commander.” It:
- Receives the alert (or signal) and opens an investigation
- Determines the investigation plan (what to check, in what order)
- Delegates tasks to specialist agents
- Maintains a shared incident state (context, hypotheses, evidence, conclusions)
- Produces the final summary in a clean, on-call-friendly format (Slack-first, with links to deeper detail)
Think of it as the agent that turns “an alert fired” into a structured workflow.
2) The Context & Topology Agent
This agent answers: “What is this service connected to?”
It builds and continuously refreshes a system map using:
- Kubernetes API discovery (Deployments, Pods, Services, Ingress, HPA/VPA, ConfigMaps, Secrets references, etc.)
- Service-to-service and workload-to-database relationships
- Runtime context (namespace ownership, env, cluster, rollout history)
Output is a dependency graph and blast radius estimate:
- Upstream callers impacted
- Downstream dependencies likely causing the symptom
- Criticality and scope
This is what prevents investigations from being “log diving” with no direction.
3) The Signals Agent (Logs / Metrics / Traces)
This agent answers: “What does the telemetry say right now?”
It gathers and correlates:
- Metrics (latency, error rate, saturation)
- Logs (error clusters, anomalies, timeline alignment)
- Traces (hot paths, downstream waits, slow spans)
- Baselines (“what is normal for this service at this time?”)
The key is correlation, not collection. The agent builds a timeline:
- When did the change start?
- Which signals moved first?
- Which components show causal indicators vs. downstream symptoms?
4) The Change Intelligence Agent
This agent answers: “What changed?”
It inspects:
- Recent deployments and rollouts
- Config drift and Helm/ArgoCD deltas
- Dependency version changes
- Feature flags / environment variables
- Known risk patterns (e.g., new DB migrations, connection pool changes)
It produces a ranked list of candidate change events and ties them to the incident timeline.
5) The Hypothesis & RCA Agent
This is the reasoning layer that answers: “What is the most likely root cause, and why?”
It takes evidence from:
- Topology (what can affect what)
- Signals (what is actually happening)
- Changes (what likely triggered it)
Then it builds:
- A small set of root-cause hypotheses
- Evidence for / against each hypothesis
- The most probable RCA + contributing factors
Crucially, it’s designed to avoid hand-wavy conclusions. If evidence is weak, it says so and requests the next best verification step.
6) The Remediation Agent
This agent answers: “What can we do right now to restore service?”
It generates:
- Safe, step-by-step runbooks (commands and checks)
- Proposed mitigations (scale, restart, roll back, disable feature, adjust limits)
- Verification steps (what metrics/logs should improve after the fix)
Depending on policy, it can operate in:
- Recommend-only mode (default for early rollout)
- Human-in-the-loop mode (execute after explicit approval)
- Auto-remediate mode for pre-approved actions
We intentionally separate “decide” from “execute” for safety.
7) The Prevention & Resilience Agent
This agent answers: “How do we stop this from happening again?”
It proposes improvements like:
- Better alerts (less noise, more signal, better grouping)
- Missing SLOs and error budget suggestions
- Resource policy fixes (limits/requests, HPA tuning)
- Reliability hardening (timeouts, retries, circuit breakers)
- Database hygiene (indexes, query optimization, pool sizing)
- Deployment safety (canaries, rollback triggers, progressive delivery)
This is how incident response turns into reliability engineering — automatically.
8) The Policy & Guardrails Agent
This agent enforces boundaries:
- Which clusters/namespaces the agent can access
- Which actions are allowed (and under what conditions)
- Which data is sensitive and must be masked
- Audit logging and traceability for every action and conclusion
It’s the difference between “cool demo” and “production-safe automation.”
How the Agents Collaborate (End-to-End Flow)
A typical investigation looks like this:
- Alert arrives → Orchestrator opens the case
- Topology agent maps dependencies + blast radius
- Signals agent correlates logs/metrics/traces into a timeline
- Change agent finds the most relevant deltas
- RCA agent ranks hypotheses and validates with evidence
- Remediation agent proposes immediate actions + verification
- Prevention agent proposes long-term fixes
- Orchestrator writes a clean Slack summary + detailed report link
This multi-agent structure is what makes the system behave like an SRE team: parallel work, shared context, and a single coherent outcome.
Subscribe to our email newsletter and unlock access to members-only content and exclusive updates.
Comments