Last week, we shared a walkthrough of the OpsWorker.ai onboarding experience — connecting clusters, configuring alerting, and integrating Slack so teams can see investigation results right inside their natural workflow.
This week, we’re shifting from setup to real incident analysis.
The goal: show how OpsWorker acts as an AI SRE Agent, diagnosing real-world failures that engineers deal with every day. No synthetic examples, no artificial logs — just two classic failure modes that happen constantly in cloud-native systems.
These simulations highlight how OpsWorker reduces MTTR, cuts down on on-call fatigue, and minimizes the cross-team back-and-forth that usually slows incident response.
Alert Rules & Setup Before the Simulation
Before diving into the incidents, we configured OpsWorker to automatically investigate only alerts coming from the evershop namespace — a Node.js–based shop application using AWS RDS.
This ensures the system stays focused on what matters instead of burning cycles on noisy development alerts.
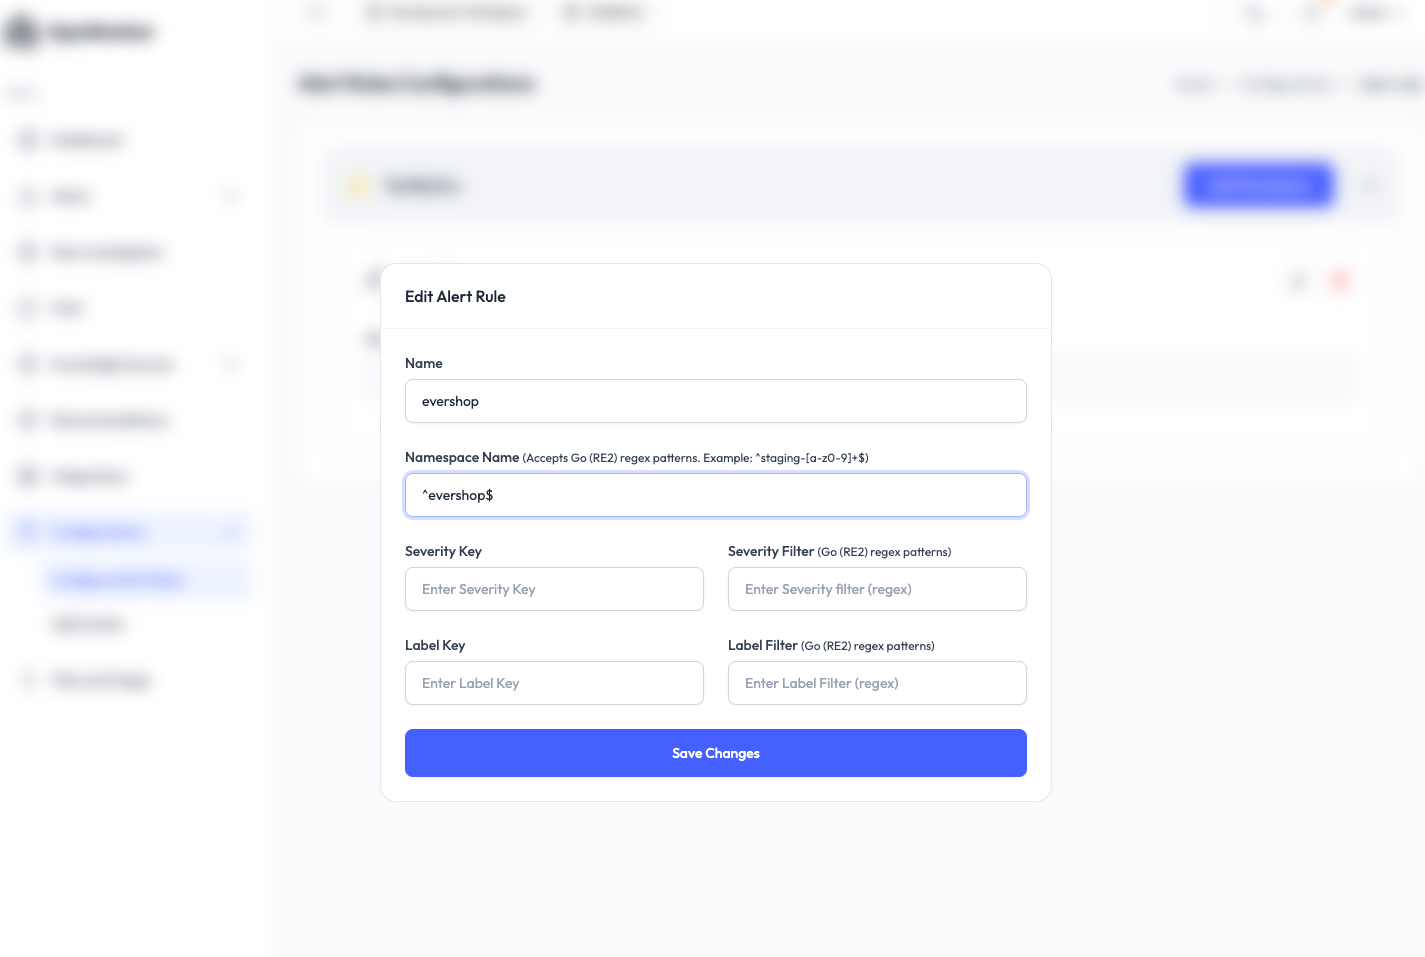
Once the alert rules were in place, we moved to the first simulation.
Incident #1 — CPU Saturation & HPA Maxing Out
To recreate a real production outage, we artificially pushed CPU usage high enough to hit the HPA ceiling.
We intentionally set the max replicas to 2, making it easier to reach resource exhaustion quickly. Running a CPU-filling request (fill-cpu) pushed the service over the edge — and the evershop application dropped.
Alerts:
KubeHpaMaxedOutCPUThrottlingHigh(in some cases if we run /api/fill-cpu?c=100)
helm upgrade --install evershop chart/ --set dns.prefix="evershop" --set global.resources.limits.cpu="200m" --namespace evershop --create-namespace
# wait 2 min to normalize CPU usage
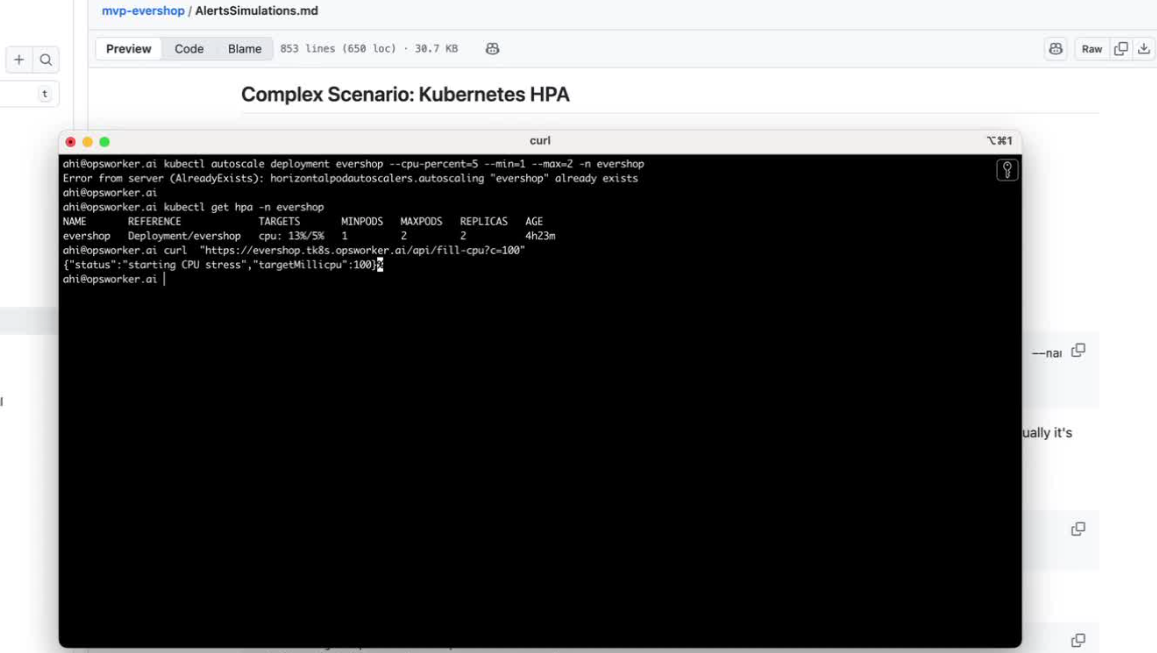
kubectl autoscale deployment evershop --cpu-percent=5 --min=1 --max=2 -n evershop
Since container is limited to 200m (millicores), setting the threshold at 5% (10m) ensures HPA reacts when usage hits ~10m.(usually it's close to 30m)
Step 2: In case you still dont see get Alert KubeHpaMaxedOut alert
# Utilizes approximately 100 millicores (0.1 CPU) using a timed busy loop.
curl https://everhop.tk8s.opsworker.ai/api/fill-cpu?c=100
the special API /api/fill-cpu in evershop is customized code added by OpsWorker Team
How to check manually
kubectl get hpa -n evershop
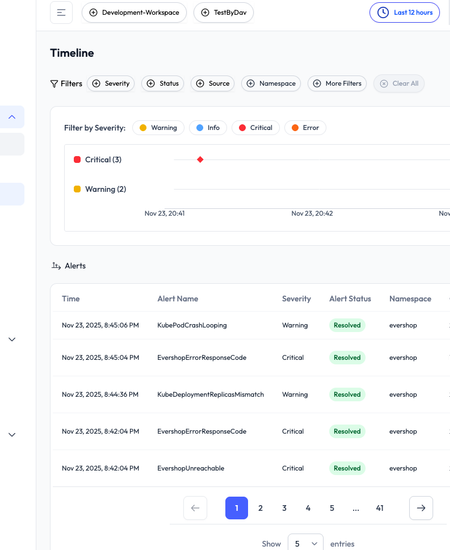
A few minutes later, Alertmanager fired.
OpsWorker received the alert and, because it matched our rules, automatically launched an investigation.
What OpsWorker Found
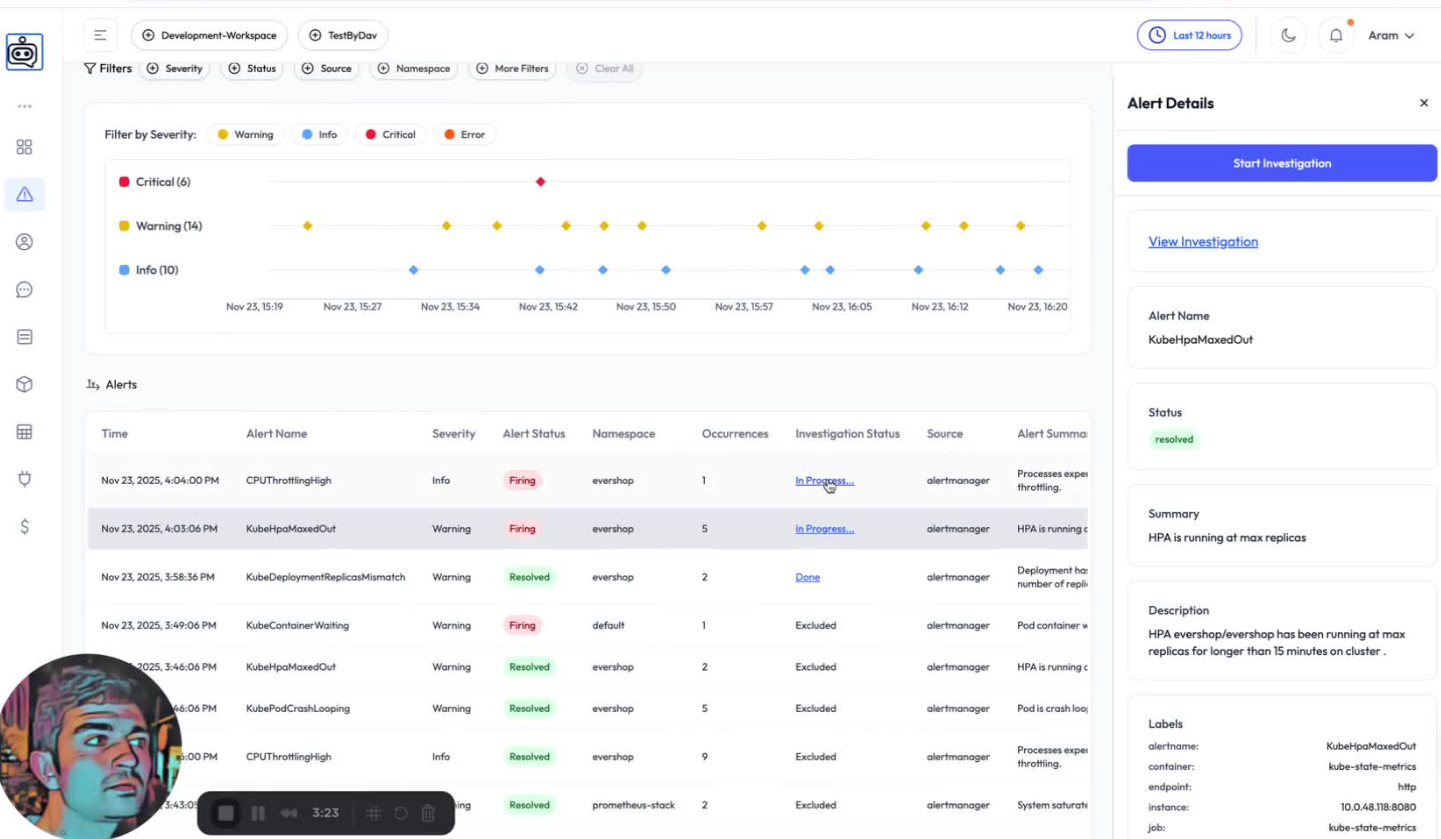
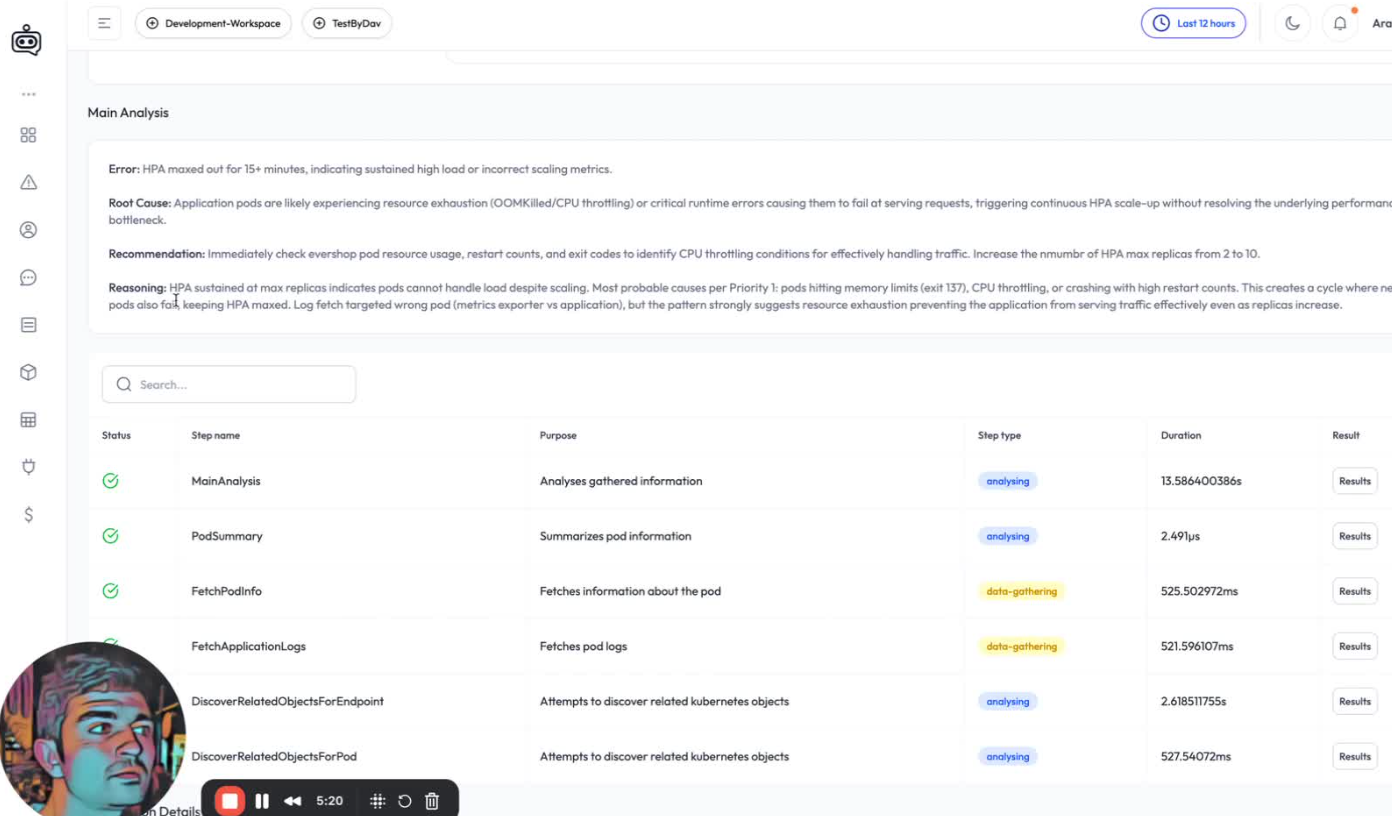
The AI SRE Agent traced the alert back to the deployment and highlighted the critical signals:
Error: HPA maxed out for 15+ minutes, indicating sustained high load or incorrect scaling metrics.
Root Cause: Application pods are likely experiencing resource exhaustion (OOMKilled/CPU throttling) or critical runtime errors causing them to fail at serving requests, triggering continuous HPA scale-up without resolving the underlying performance bottleneck.
Recommendation: Immediately check evershop pod resource usage, restart counts, and exit codes to identify CPU throttling conditions for effectively handling traffic. Increase the mumbr of HPA max replicas from 2 to 10.
Reasoning: HPA sustained at max replicas indicates pods cannot handle load despite scaling. Most probable causes per Priority l: pods hitting memory limits (exit 157), CPU throttling, or crashing with high restart counts. This creates a cycle where ne ods also fait keeping HPA maxed. Log fetch targeted wrong pod (metrics exporter vs application), but the pattern strongly suggests resource exhaustion preventing the application from serving traffic effectively even as replicas
Root Cause Identified
The workload hit CPU saturation, and HPA reached the configured max replica limit.
Incident #2 — Memory Leak, OOM Crash & Liveness Probe Failures
Next, we simulated a memory leak that forces the pod into OOMKill, followed by liveness probe failures and cascading 503 errors — a problem many teams have had to chase manually.
After triggering the scenario, evershop went down again.
Alertmanager fired almost immediately with 503 failures, and OpsWorker started its investigation.
Alerts:
- CrushLoopback
- In case User have Container OOMKill alert, then it also may come.
- Blackbox Exporter endpoint unreachable, 502 Error code, 503 Error code
Steps to simulation:
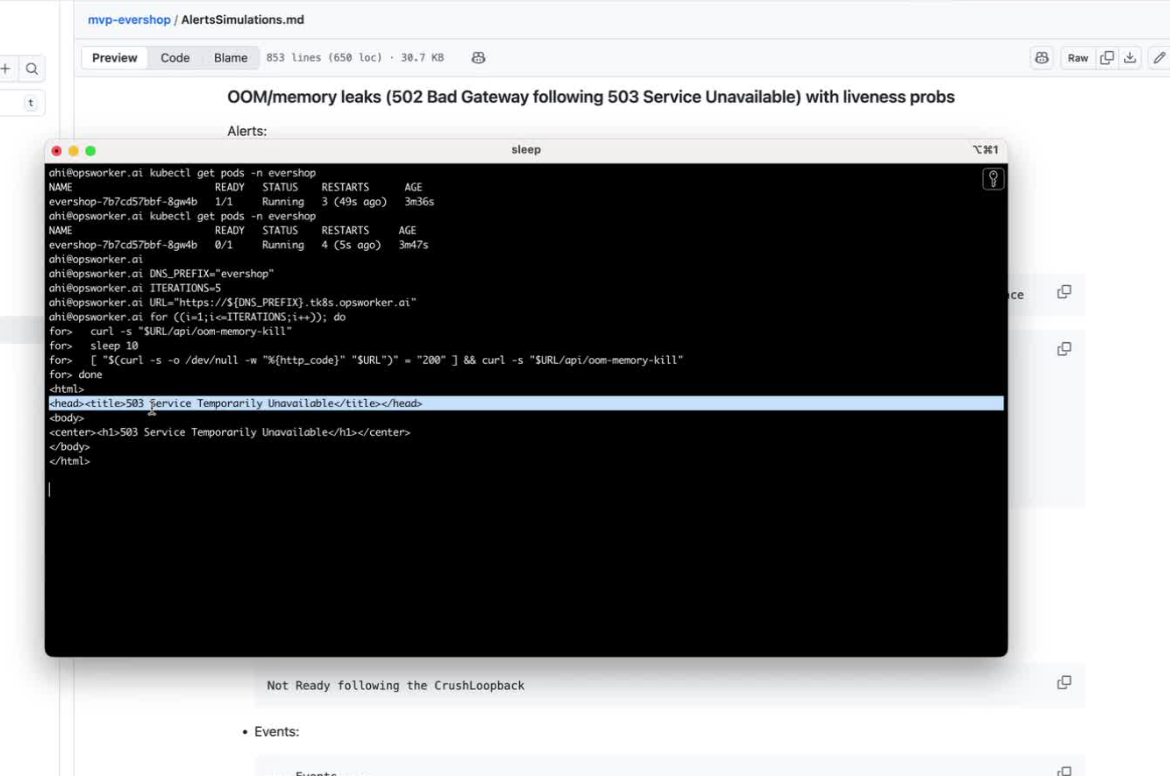
#!/bin/bash
DNS_PREFIX="evershop"
ITERATIONS=5
URL="https://${DNS_PREFIX}.tk8s.opsworker.ai"
for ((i=1;i<=ITERATIONS;i++)); do
  curl -s "$URL/api/oom-memory-kill"
  sleep 10
  [ "$(curl -s -o /dev/null -w "%{http_code}" "$URL")" = "200" ] && curl -s "$URL/api/oom-memory-kill"
done
helm upgrade --install evershop chart/ --set dns.prefix="evershop" --namespace evershop --create-namespace
What OpsWorker Detected
The AI SRE Agent pulled together signals from multiple layers:
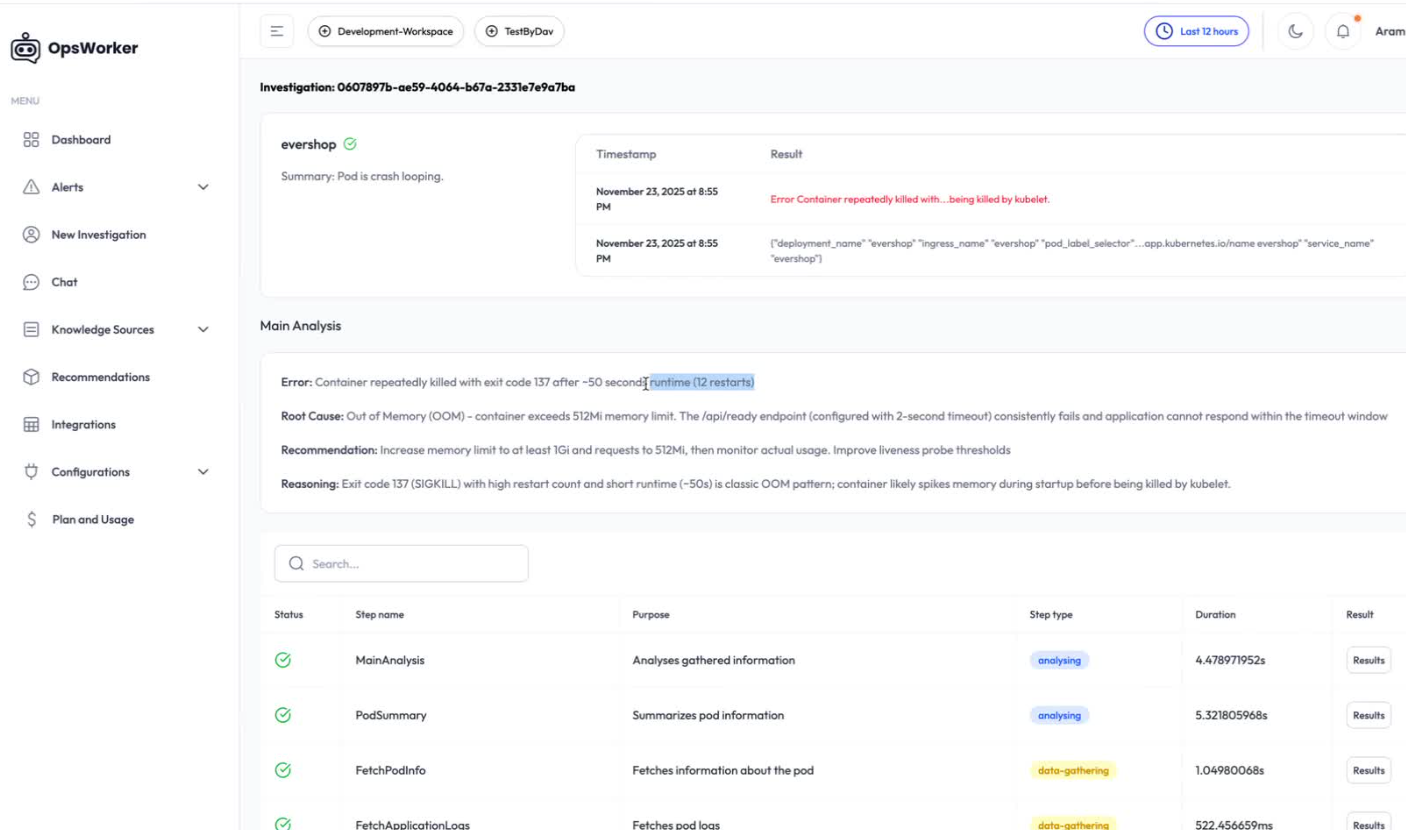
Error: Container repeatedly killed with exit code 137 after -50 second [runtime (12 restarts)
Root Cause: Out of Memory (OOM) - container exceeds 512Mi memory limit. The /api/ready endpoint (configured with 2-second timeout) consistently fails and application cannot respond within the timeout window
Recommendation: Increase memory limit to at least 1Gi and requests to 512Mi, then monitor actual usage. Improve liveness probe thresholds
Reasoning: Exit code 137 (SIGKILL) with high restart count and short runtime (-50s) is classic OOM pattern; container likely spikes memory during startup before being killed by
Root Cause Identified
A memory leak triggered OOMKill, causing pod restarts and repeated readiness probe failures.
Why This Matters for MTTR, On-Call Load & Cross-Team Handoffs
These two examples highlight the real value of an AI SRE Agent:
- MTTR drops dramatically, because the system correlates signals instantly
- SREs get answers, not dashboards
- Developers ("you build it, you run it") get clarity, not guesswork
- Cross-team communication shrinks, since OpsWorker brings everything into one place
- On-call becomes more predictable, because the agent handles the first layers of early-stage triage
This is what it looks like when AI starts taking over the ops work nobody wants to do in the first place.
What’s Next
Next week, we’ll go even deeper.
We’re publishing an article exploring Agent-Driven SRE Investigations — where instead of using a single assistant, we simulate a coordinated team of AI agents working together like a real SRE team.
This is built on top of:
- Kubernetes MCP
- GitHub MCP
We’ll share what works, what breaks, and what it takes to design multi-agent workflows that go beyond reaction and move toward true collaborative root cause resolution.
Stay tuned — and as always, we welcome your feedback.
OpsWorker is improving every week thanks to it.
Subscribe to our email newsletter and unlock access to members-only content and exclusive updates.
Comments