Last week, we rolled out a major update to OpsWorker.ai, our 24/7 AI SRE Agent designed to help SRE, Engineering and Platform teams detect, investigate, and resolve incidents across Kubernetes clusters — with minimal manual effort.
In this post, I’ll walk you through what’s new, how we’re improving the user experience, and what’s coming next as we expand deeper into automated remediation and agentic architectures.
Why OpsWorker?
If you’ve spent any time in modern cloud environments, you already know the pain: Incidents rarely come with clean answers. You get a vague alert, jump into Grafana, scan kubectl, cross-check Git history, Slack someone from the infra team… and still don’t know why your service is down.
Meanwhile, engineers lose hundreds of hours per year chasing issues across fragmented systems. Most of them are Level 1 or Level 2 problems — misconfigurations, resource limits, bad image tags, missed dependencies — but they still pull teams away from product work.
OpsWorker.ai is built to automate that early-stage chaos.
It acts as your AI SRE CoWorker:
- Ingests alerts from Kubernetes and observability tools
- Correlates across services, infrastructure, and config
- Investigates root causes with real-time reasoning
- Pushes remediation context to where teams already work (Slack, etc.)
This week’s demo focused on what we’ve built to make that experience smooth and transparent — from onboarding clusters to visualizing investigations.
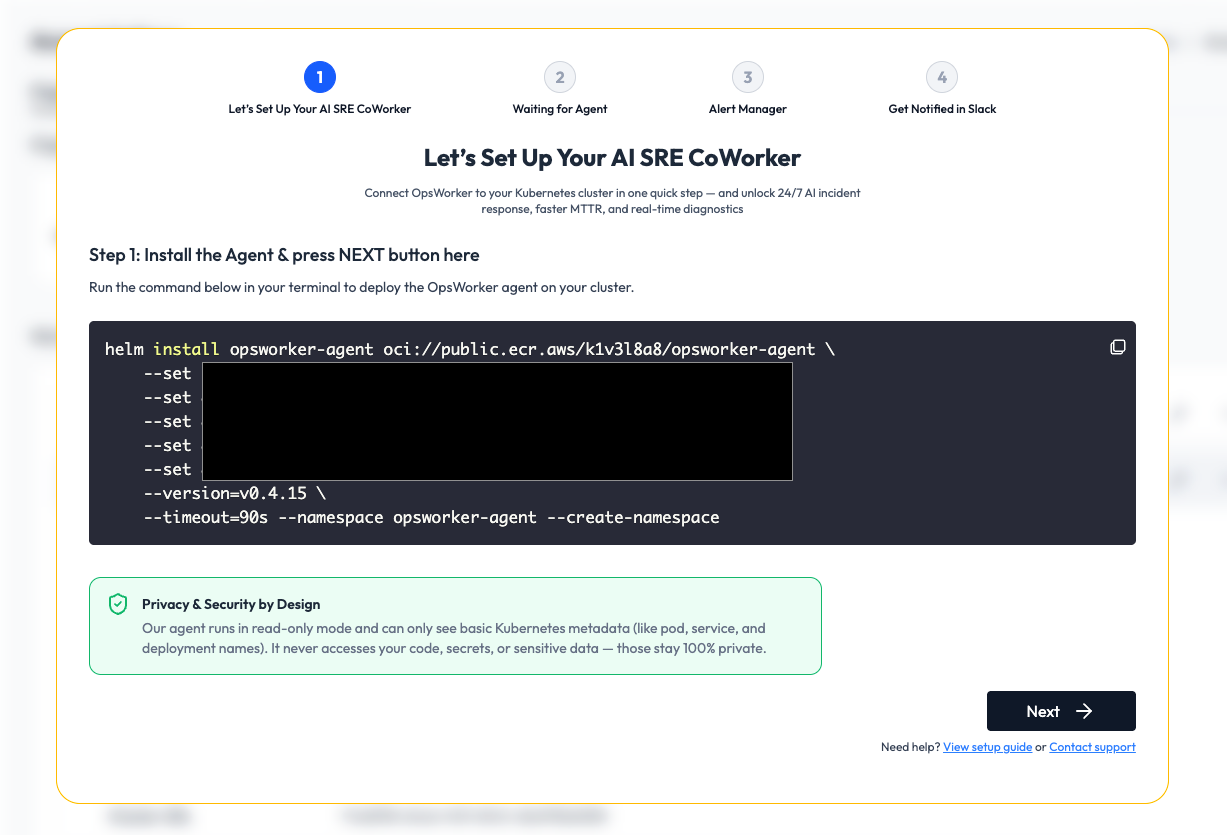
Onboarding & Setup (Simple by Default)
Getting started is fast:
- Login with Google Auth
- Deploy our lightweight read-only agent to your cluster
- Connect Alertmanager via webhook
- Optionally link your Slack workspace
Once connected, you can configure alert rules to determine which namespaces, workloads, or severity levels should trigger automated root cause investigations — or you can manually launch them from the UI.
Slack integration ensures your team gets visibility without switching context — alerts come in, analysis happens, and recommendations are delivered where people are already collaborating.
🧭 Workspaces: Flexible Boundaries for Teams & Clusters
We’ve introduced a Workspace model to help teams organize their environments logically — whether by environment (prod, staging), team (payments, infra), or business unit.
Each workspace can contain multiple clusters and has scoped access control, allowing users to be invited and assigned either admin or read-only roles.
This design keeps things clean and secure — especially in multi-tenant setups or when managing multiple customer clusters.
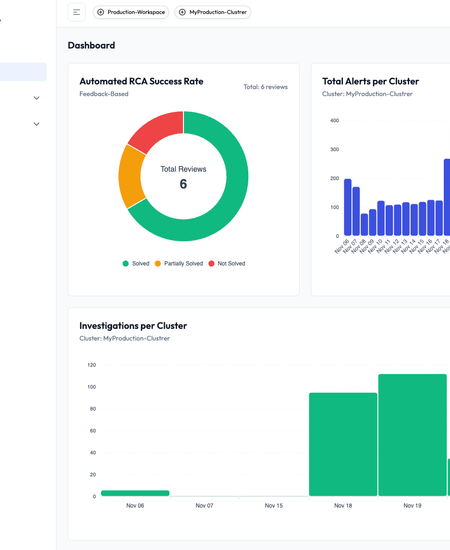
📊 Alert & Investigation Visibility
Once your cluster is connected, the dashboard gives you a clear view of:
- Total alerts received
- Breakdown by cluster, namespace, and severity
- Historical investigation success/failure rates
- Timeline of recent investigations and outcomes

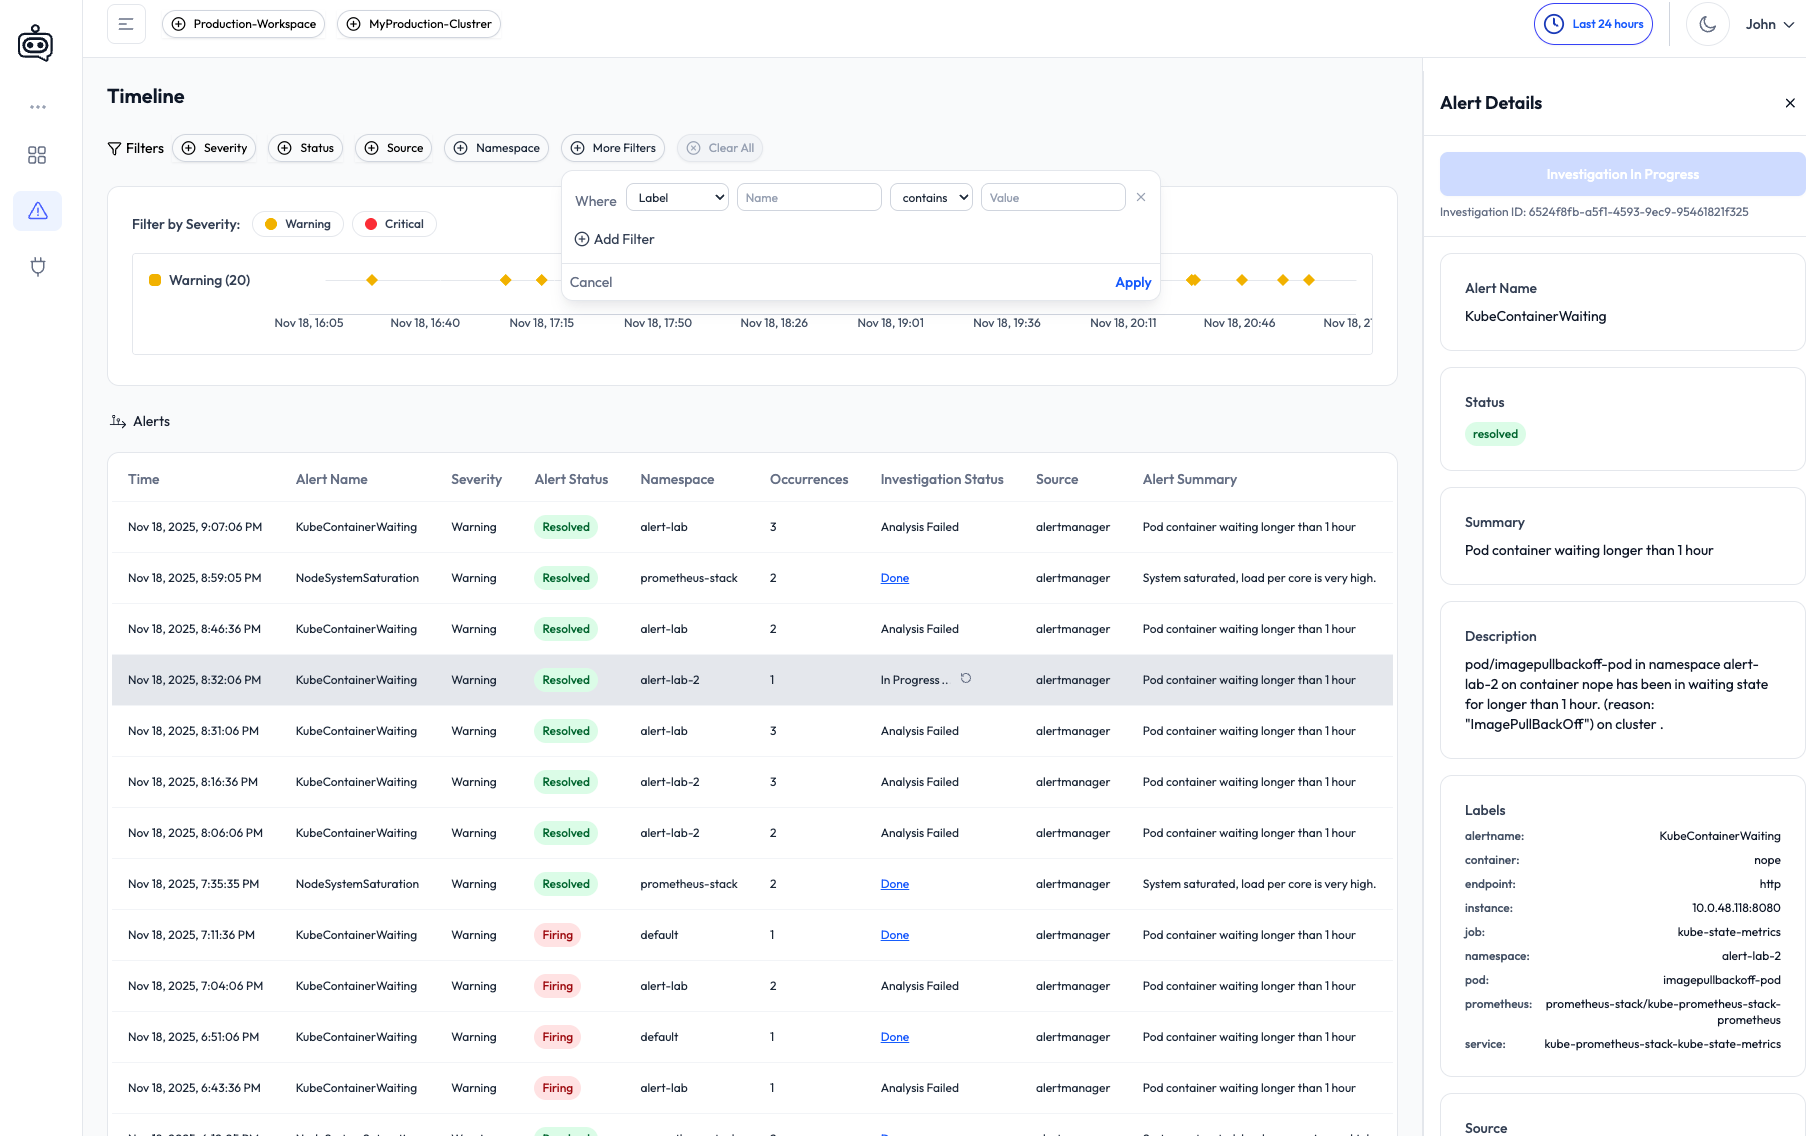
In the Alert Timeline, you can inspect each alert in detail, use filters to drill down (e.g., by source, severity, or namespace), and trigger manual investigations.
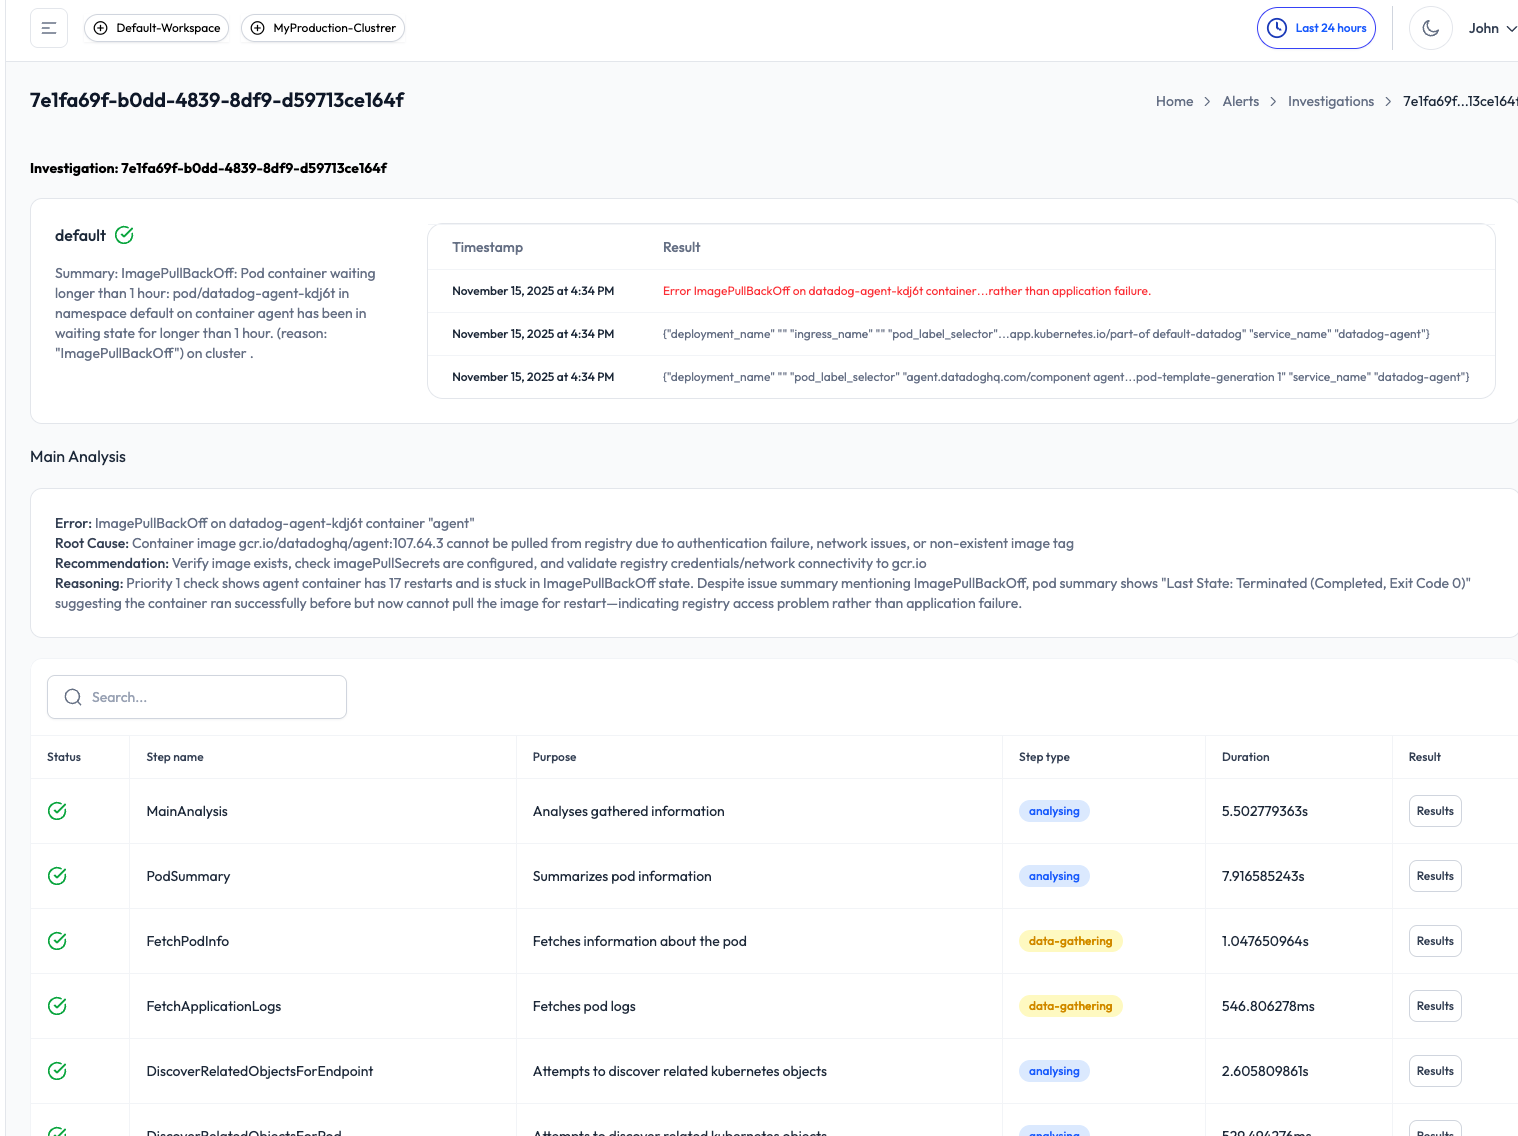
Completed investigations include:
- A plain-language summary of the issue
- Timeline of actions and signals analyzed
- Root cause (if detected)
- Remediation guidance
- Slack delivery, so the whole team stays in the loop
🔐 RCA Rule Configuration
Under the hood, you can define rules for automatic investigations:
- Select which namespaces, workload labels, or alert severities should be auto-investigated
- Example: Only investigate
shop|paymentservices in theproductionnamespace when a P1 or P2 alert is triggered
This keeps investigations relevant and avoids noise in non-critical environments.
You can also onboard new clusters to any workspace at any time — with the same setup flow.
🔍 What’s Next: From Automation to Agentic Intelligence
We’re just getting started.
🧪 Coming Next Week:
We’ll simulate real-world production incidents — including memory leaks and readiness probe failures — and show how OpsWorker:
- Maps service dependencies
- Traces event chains
- Surfaces actionable root causes
- Pushes remediation guidance, automatically
🤖 The Week After: Agent-Driven Investigations
We’ll publish a deep dive into multi-agent SRE collaboration, where we simulate a team of AI agents working together — just like human SREs during an incident.
Instead of a single assistant, we’re testing a distributed, collaborative model:
- Built around Kubernetes MCP and GitHub MCP
- Each agent owns part of the investigation (logs, infra, DB, CI/CD, etc.)
- The system reasons in parallel — not sequentially
We’ll share real-world examples, what works, what doesn’t, and what it takes to build agentic workflows that go beyond reactive responses.
🙌 Wrapping Up
This release is all about getting the fundamentals right — fast onboarding, clean UI, clear feedback loops, and visibility into how the system is reasoning.
Suppose you're dealing with alert fatigue, slow incident response, or time-consuming root cause analysis. In that case, OpsWorker.ai gives your team a powerful new layer of automation — without requiring you to change your stack or processes.
And if you're curious about where AI in infrastructure is going next, stay tuned.
We’re just getting started.
👉 Want early access or to become a design partner?
Reach out or try the product by signing up— and let’s build this futures together.
Subscribe to our email newsletter and unlock access to members-only content and exclusive updates.
Comments