By Nune Isabekyan, Co-Founder & Cloud Architecture Expert at OpsWorker | March 2026 | 8 min read
Here's something nobody says out loud in postmortems.
The issue was visible in staging for three days. The team didn't catch it. Not because they were careless. Because staging was generating 200+ alerts a day, and at some point, the team made a rational decision: reading 24/7 individual alerts every morning is not a useful way to spend 30-80 minutes. So they stopped. They accepted the risk quietly and moved on.
The action item in the postmortem: "We should review staging alerts every morning."
Same cycle. Next time.
The problem isn't that teams don't care about staging
It's that raw alert volume is the wrong unit of information.
If you had 200 alerts yesterday and 200 today, nothing is newly wrong. The system is in some steady state, healthy or not. Reviewing that list tells you almost nothing actionable.
If you had 3 memory alerts yesterday and 7 today - that's a trend. That's something moving in a direction. That's worth 5 minutes before it becomes a 3 AM page.
If there were no CPU throttling alerts in your search service yesterday, and today there are 4 - something changed. Something new entered the system. Left alone for a week, under load, this becomes the kind of incident where everyone says "how did we not see this coming?"
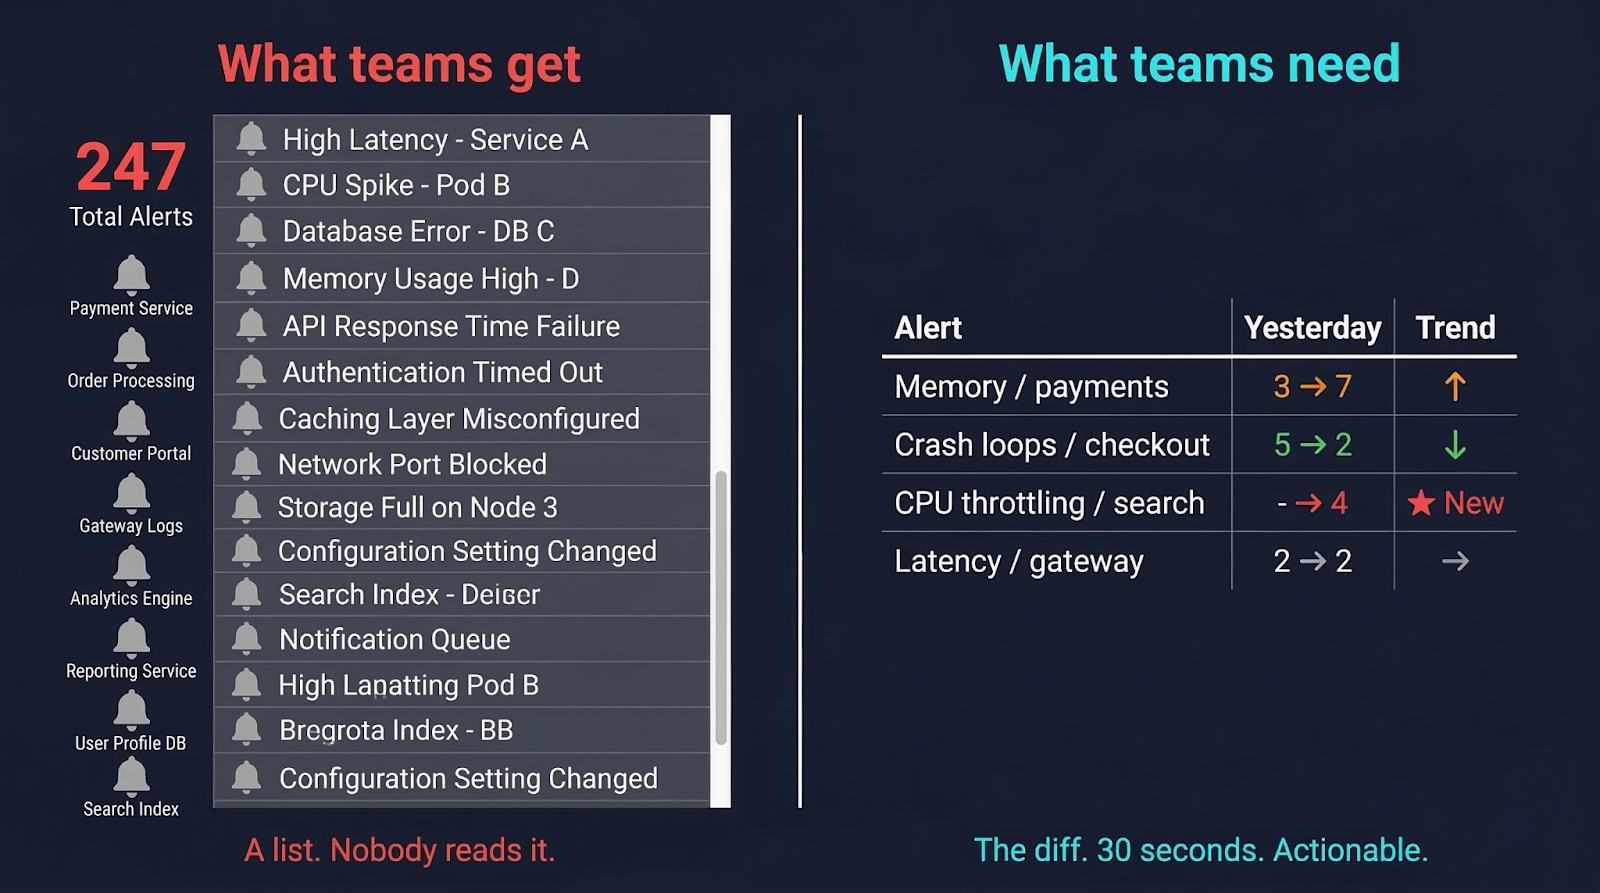
The diff is what matters. Not the count. Not the list.
This is obvious when you say it out loud. But most alerting setups don't surface the diff. They surface the list. And a list of 247 things is not something a human brain processes well at 9 AM.
We kept telling teams to review their staging alerts. They kept not doing it - for completely rational reasons. At some point you have to ask: maybe the ask is wrong, not the team.
So we changed what we ask teams to do
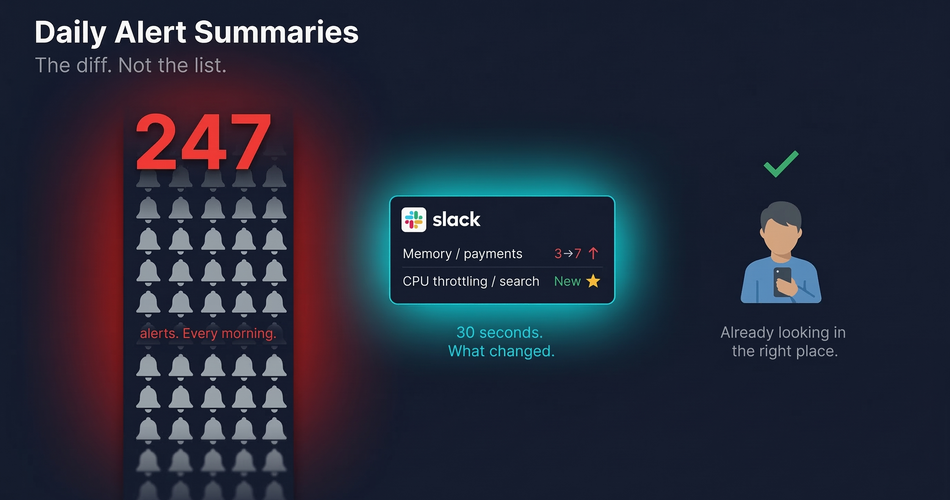
We built Daily Alert Summaries.
Every morning at 9:00 AM UTC, OpsWorker automatically runs a job to compare alerts across all types and create a daily digest. It compares yesterday's data against the day before. Then it sends a single Slack message with the changes.
Not the alerts. The changes in the alerts.
The headline message shows total alert count with the day-over-day delta, investigation status breakdown, and the significant changes flagged clearly: what's new, what increased, what decreased, which namespaces started alerting when they weren't before. Below that, a detailed thread breaks it down by cluster, namespace, and service - so if something needs a closer look, you know exactly where to find it.
Here's what that looks like in a real scenario:
Memory in payments doubled. Worth a look before it becomes an outage. Crash loops in checkout dropped - maybe that fix from last week actually worked. CPU throttling in search is brand new, wasn't there yesterday. All four of these signals visible in a 30-second Slack read.
Without the summary, all four are buried in 247 individual alerts that nobody opened.
Watch it in action: Daily Alert Summaries - OpsWorker demo video →
What's actually happening under the hood
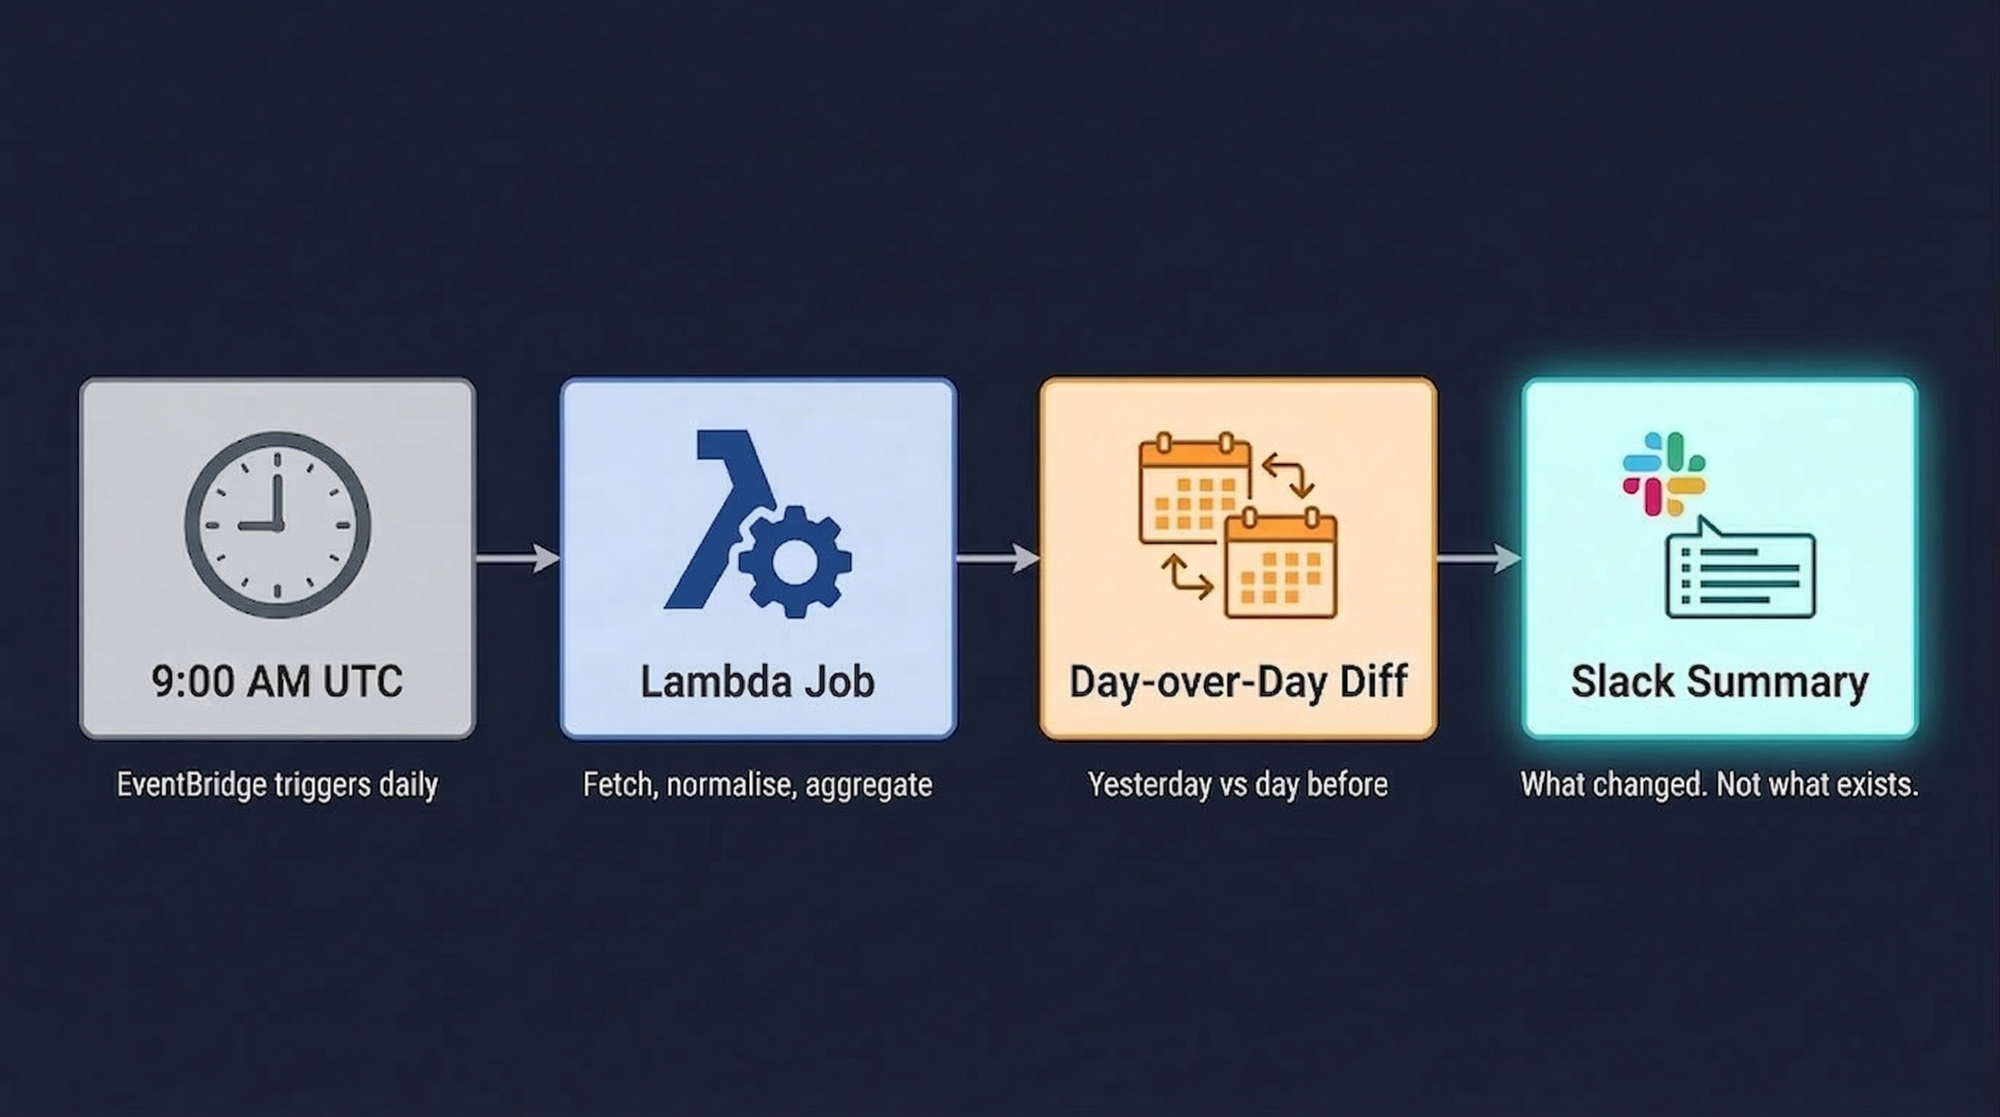
The trigger is an Amazon EventBridge CRON rule at 09:00 UTC daily. It invokes a Lambda function that discovers all organizations and clusters from DynamoDB, pulls alert data for the two-day window, normalizes and aggregates it using pandas DataFrames, then formats and posts a Slack Block Kit message.
Two details worth noting.
Block Kit matters more than it sounds. We're not posting plain text - we're posting structured layout with trend indicators and grouped sections. The difference between "a Slack message you scan in 30 seconds" and "a wall of text you close immediately" is mostly formatting. Block Kit is what makes the former possible.
Resilience is built in. Exponential backoff with five retry attempts, Slack API rate limiting respected, hard limits on block count (45 blocks) and section length (1000 chars). A daily summary that occasionally fails silently is almost worse than no summary - you think you're covered and you're not. So we made failure loud and retries automatic.
Every report is also archived as raw JSON to S3 for historical analysis. Today's summary is useful. Six months of summaries is a different kind of useful - trend analysis across quarters, before-and-after comparisons around major releases, the kind of data that changes how you think about environment health over time.
The thing we kept getting wrong before we built this
We spent a while trying to make alert review less painful instead of making it unnecessary.
Better dashboards. Smarter grouping. Digest emails. All of it still asked the engineer to hold the entire alert state in their head and reason about what was normal versus what wasn't. That's hard on a Tuesday morning. That's nearly impossible at the end of a long sprint.
The shift that actually worked: stop asking humans to compare states across time in their head, and just do the comparison for them. Present the delta, not the data. Let humans do what humans are good at - looking at "memory in payments went from 3 to 7" and deciding whether that's a deployment artifact or an actual leak.
The system handles the comparison. The engineer handles the judgment. That split is what makes it work.
Who this actually helps
The obvious answer is SRE, DevOps and Software Engineers working based on DevOps philosophy "You build it, you run it" (YBIYRI), where development teams own the entire lifecycle of their services, from design and coding to deployment, monitoring, and 24/7 on-call suppor, in teams who want proactive awareness of staging health without manual triage. True.
But the less obvious answer: engineering managers. Not because they should be reviewing staging alerts themselves - they shouldn't. But because they're the ones accountable when something that was visible in staging for three days reaches production and causes a customer-facing incident. A daily summary gives them a lightweight signal about environment stability across all clusters without requiring them to context-switch into alert management.
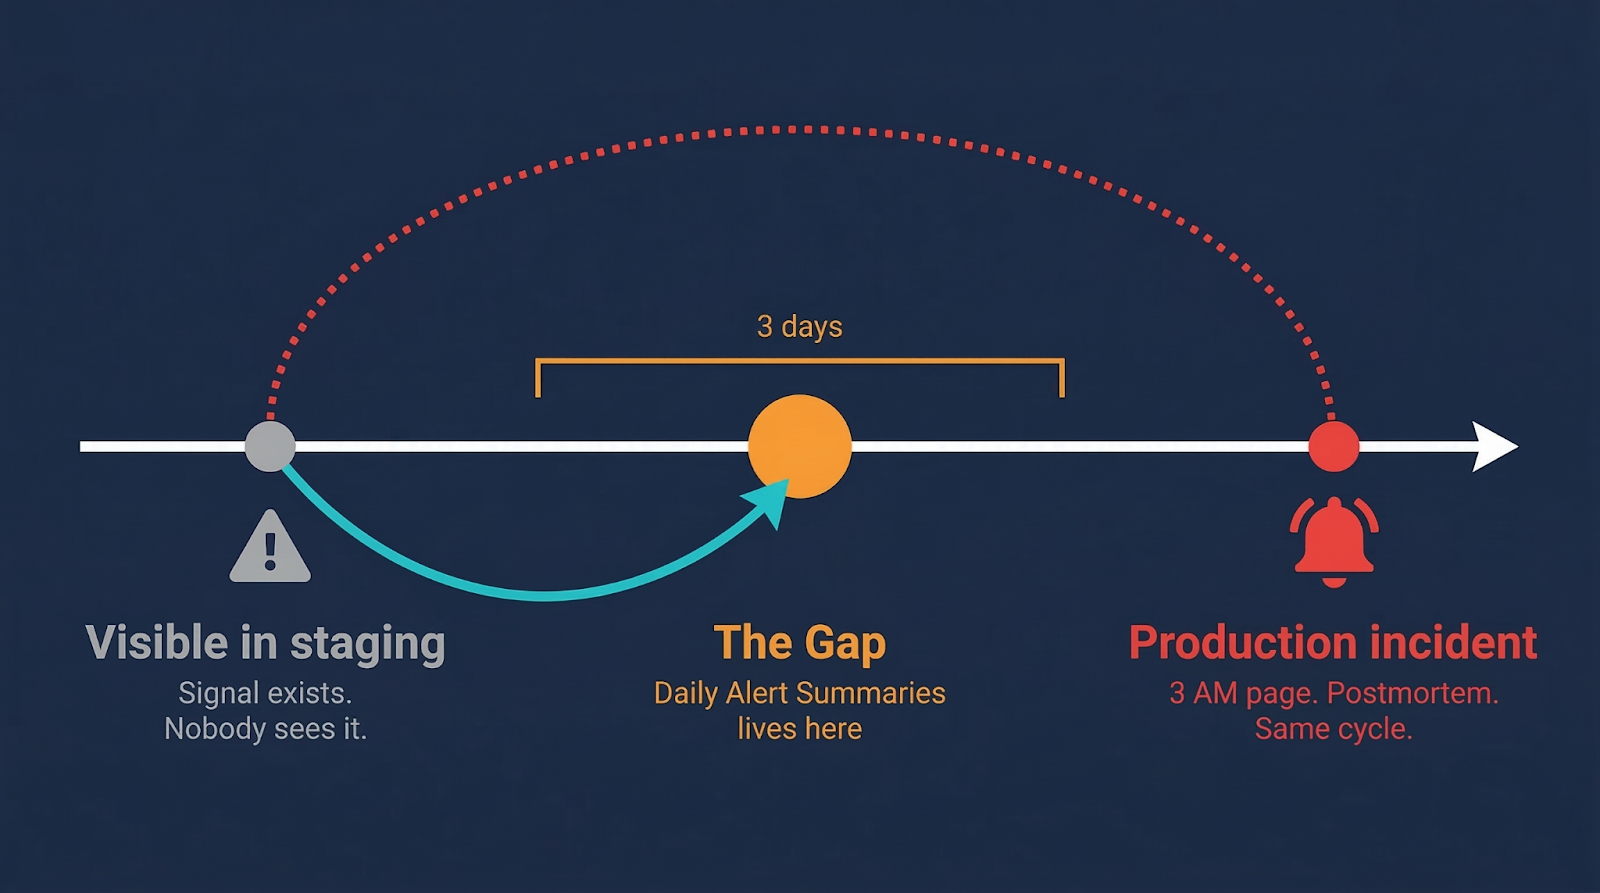
And on-call engineers specifically. The summary arrives at 9 AM UTC. That's morning context before the day starts, before the first meeting, before anything urgent lands. If the summary shows CPU throttling in search is new and increasing, that engineer goes into the day knowing where to look. Not reacting after the fact - already looking.
There's a version of on-call that's entirely reactive. Alert fires, engineer wakes up, investigation starts. OpsWorker's core investigation product handles that version well - under two minutes from alert to root cause, delivered to Slack automatically.
Daily Alert Summaries handles the version before that. The version where the problem isn't yet loud enough to page anyone, but is clearly heading somewhere bad. The gap between "visible in staging" and "incident in production" is exactly where this lives.
Zero configuration. That part is deliberate.
No setup required beyond the Slack integration you already have. No thresholds to tune, no rules to write, no namespaces to explicitly include. OpsWorker discovers your clusters and starts tracking automatically.
We made it zero-configuration on purpose. Configuration is where good intentions die. The teams that need this most are not the ones with time to spend fine-tuning alert summary rules. They're the ones who are already skipping the manual review because it takes too long.
The right behavior here is: it works from day one, and it improves as your cluster history accumulates. The first summary compares yesterday against the day before. The tenth summary is part of a pattern. The hundredth is part of an institutional memory of how your environments behave.
No configuration required to get there. Just time.
Daily Alert Summaries is available now for all OpsWorker customers with Slack integration enabled. If you're not using OpsWorker yet and want to see what the summary looks like for your clusters, book a demo and we'll show you the real thing.
Subscribe to our email newsletter and unlock access to members-only content and exclusive updates.
Comments