Most incident management is reactive. Something breaks, an alert fires, an engineer wakes up, and the investigation starts. The industry has invested heavily in making that investigation faster - better dashboards, smarter alerting, automated runbooks. All of that happens after the failure.

Predictive analytics asks a different question: what if you could see the failure coming?

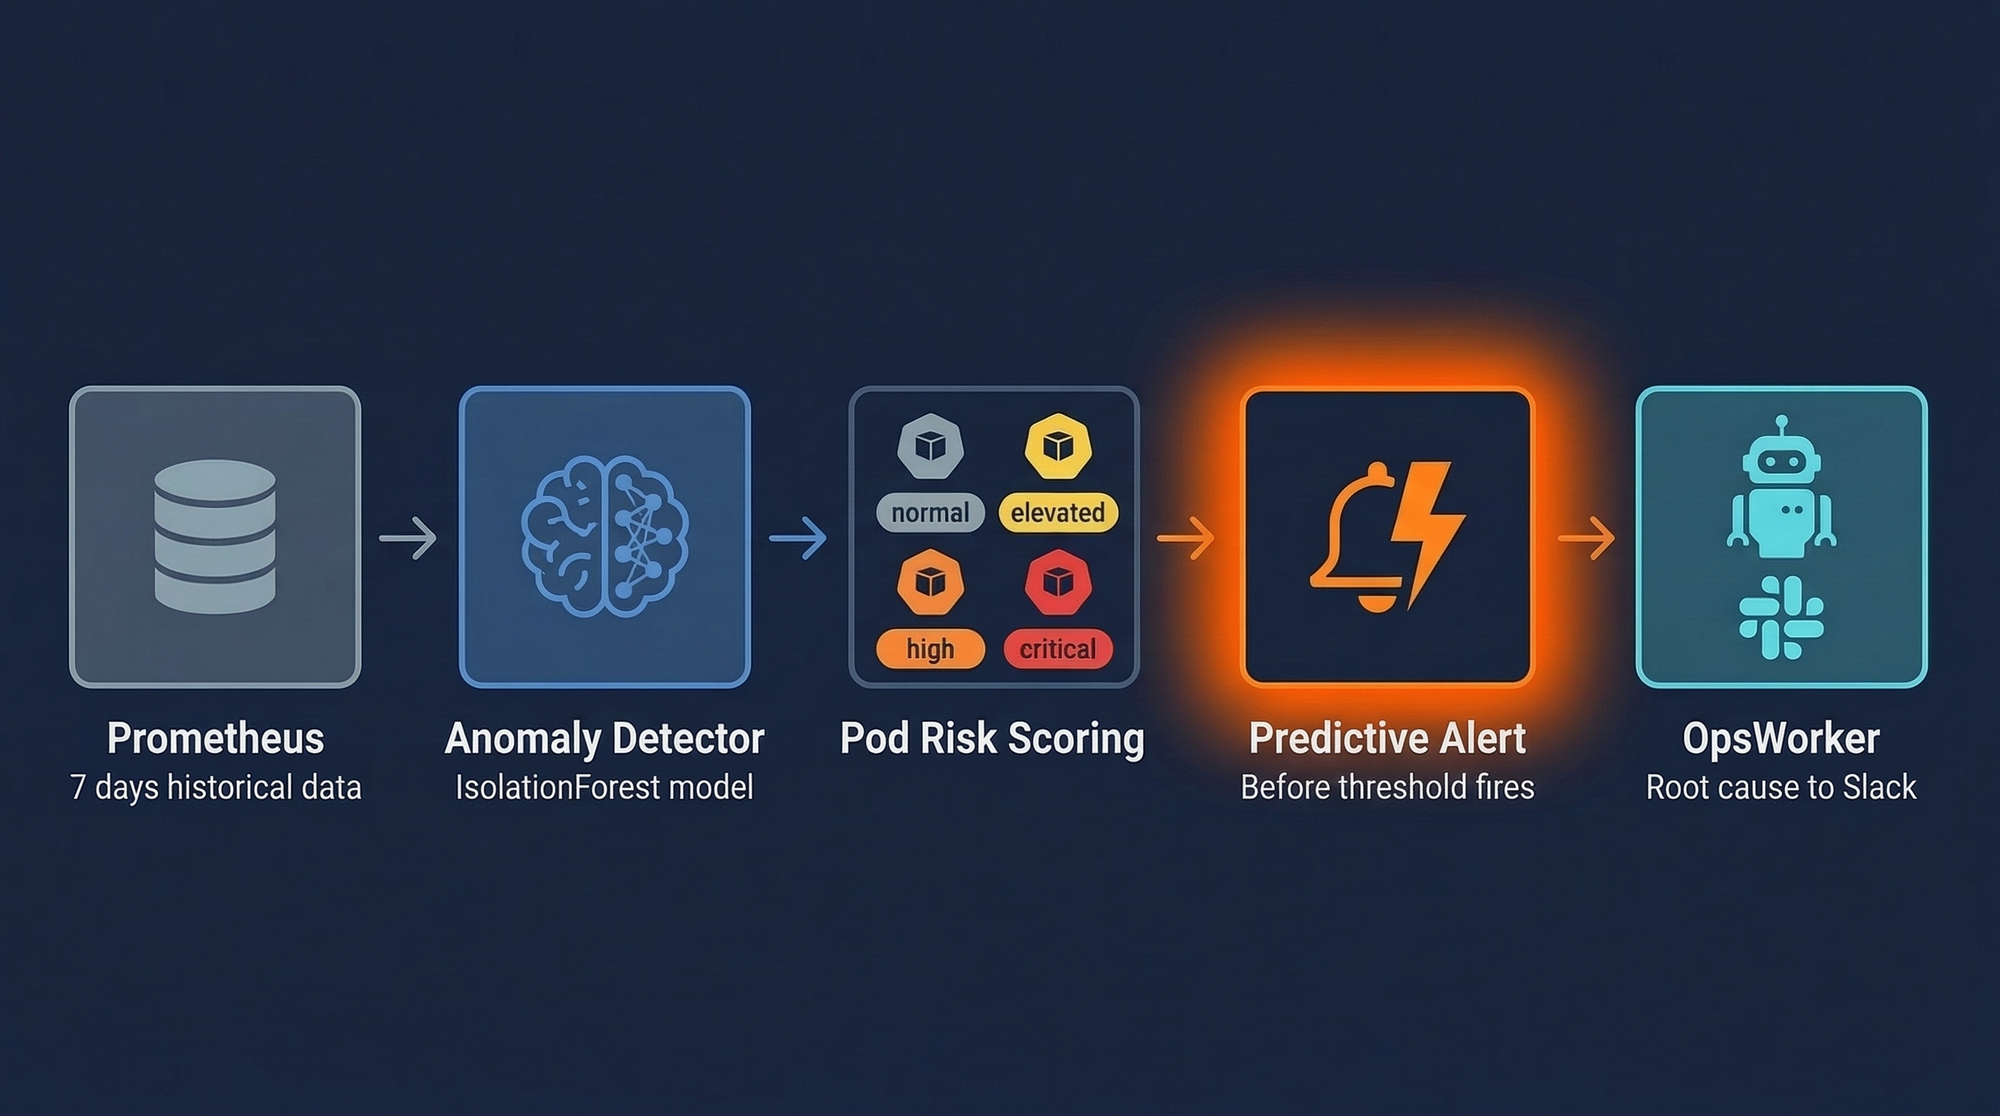
This post walks through a practical approach to building a predictive layer on top of your existing Kubernetes monitoring stack. We'll look at how to use historical Prometheus metrics to forecast pod instability, and how to connect that forecast to automated investigation so your team has context before the alert even fires.

The gap between monitoring and prediction

Standard Prometheus alerting is threshold-based. CPU above 80% for five minutes - alert. Memory limit within 10% - alert. Pod restart count above three - alert.

Thresholds work. They're also blind to the patterns that precede failures. A pod that restarts once per day is below most alerting thresholds. A pod that has restarted once per day for the past week, with a clearly accelerating trend, is almost certainly about to become a real incident. Threshold alerting treats those two situations identically.

Time-series forecasting treats them very differently.

The core idea: train a model on your historical Prometheus data to predict future resource behavior. When the predicted trajectory crosses a danger zone before it actually gets there, trigger investigation now - while the system is still healthy enough to be debugged.

Step 1 - Collecting the right historical data

The most useful metrics for pod instability prediction are:

  • kube_pod_container_status_restarts_total - restart count over time, the most direct signal
  • container_memory_usage_bytes vs kube_pod_container_resource_limits - how close to the memory ceiling
  • container_cpu_usage_seconds_total - rate of CPU consumption
  • kube_deployment_status_replicas_unavailable - replica health across a deployment

You can pull this data from Prometheus directly using the HTTP API. Here's a Python snippet to fetch the last seven days of restart counts for all pods in a namespace:

restart_history.py
Python
1
2
3
4
5
6
7
8
9
10
11
12
13
14
15
16
17
18
19
20
21
22
23
24
25
26
27
28
29
30
31
32
33
34
35
36
37
import requests
import pandas as pd
from datetime import datetime, timedelta
 
PROMETHEUS_URL = "http://prometheus.monitoring.svc.cluster.local:9090"
NAMESPACE      = "production"
 
def fetch_restart_history(namespace: str, days: int = 7) -> pd.DataFrame:
    end_time   = datetime.utcnow()
    start_time = end_time - timedelta(days=days)
 
    query = f'kube_pod_container_status_restarts_total{namespace="{namespace}"}'
 
    response = requests.get(
        f"{PROMETHEUS_URL}/api/v1/query_range",
        params={
            "query": query,
            "start": start_time.timestamp(),
            "end":   end_time.timestamp(),
            "step": "5m",   # 5-minute resolution
        },
        timeout=30
    )
    response.raise_for_status()
 
    results = response.json()["data"]["result"]
    records = []
 
    for series in results:
        pod       = series["metric"].get("pod",       "unknown")
        container = series["metric"].get("container", "unknown")
 
        for timestamp, value in series["values"]:
            records.append({
                "pod":           pod,
                "container":     container,
                "timestamp":     pd.to_datetime(timestamp, unit="s", utc=True),
                "restart_count": float(value)
            })
 
    return pd.DataFrame(records)
37 lines  ·  UTF-8 Powered by OpsWorker AI

Seven days of data at 5-minute resolution gives you 2,016 data points per pod - enough to train a basic time-series model and enough to capture weekly patterns (deployment schedules, traffic spikes, batch jobs) that would otherwise look like anomalies.

Step 2 - Building the anomaly detection model

For restart rate prediction, a straightforward approach is to model the rate of change of restarts over time and flag pods where that rate is accelerating beyond a historical baseline.

We'll use scikit-learn's IsolationForest for anomaly scoring, combined with a simple linear trend component. IsolationForest works well here because it doesn't require labeled anomaly data - it learns what "normal" looks like from the majority of your data, then scores deviations.

anomaly_detector.py
Python
1
2
3
4
5
6
7
8
9
10
11
12
13
14
15
16
17
18
19
20
21
22
23
24
25
26
27
28
29
30
31
32
33
34
35
36
37
38
39
40
41
42
43
44
45
46
47
import numpy as np
from sklearn.ensemble import IsolationForest
from sklearn.preprocessing import StandardScaler
 
def compute_features(df: pd.DataFrame, pod: str) -> np.ndarray:
    """
    Compute features for a single pod's restart history.
    Returns an array of [restart_rate, rate_acceleration, rolling_mean, rolling_std]
    """
    pod_data = df[df["pod"] == pod].sort_values("timestamp")
 
    if len(pod_data) < 30:
        return None  # Not enough data to score reliably
 
    restarts = pod_data["restart_count"].values
 
    # Restart rate: how many restarts per 5-minute window
    restart_rate = np.diff(restarts, prepend=restarts[0])
 
    # Rate acceleration: is the rate of restarting increasing?
    rate_acceleration = np.diff(restart_rate, prepend=restart_rate[0])
 
    # Rolling stats over the last 12 windows (1 hour)
    window = 12
    rolling_mean = pd.Series(restart_rate).rolling(window, min_periods=1).mean().values
    rolling_std  = pd.Series(restart_rate).rolling(window, min_periods=1).std().fillna(0).values
 
    return np.column_stack([restart_rate, rate_acceleration, rolling_mean, rolling_std])
 
 
def train_anomaly_detector(df: pd.DataFrame) -> dict:
    """
    Train one IsolationForest per pod on its historical feature data.
    Returns a dict of {pod_name: (scaler, model)}
    """
    models = {}
 
    for pod in df["pod"].unique():
        features = compute_features(df, pod)
        if features is None:
            continue
 
        scaler          = StandardScaler()
        features_scaled = scaler.fit_transform(features)
 
        model = IsolationForest(
            contamination=0.05,  # Expect ~5% of windows to be anomalous
            n_estimators=100,
            random_state=42
        )
        model.fit(features_scaled)
        models[pod] = (scaler, model)
 
    return models
47 lines  ·  UTF-8 Powered by OpsWorker AI

The contamination=0.05 parameter tells the model to treat the most unusual 5% of historical windows as anomalies. You'll want to tune this based on your environment - a cluster with frequent but harmless restarts might need a higher threshold; a stable production cluster could go lower.

Step 3 - Scoring current pod behavior

Once the model is trained, you run it continuously against recent data. Here's a scorer that returns an anomaly score and a human-readable risk level for each pod:

pod_risk_assessment.py
Python
1
2
3
4
5
6
7
8
9
10
11
12
13
14
15
16
17
18
19
20
21
22
23
24
25
26
27
28
29
30
31
32
33
34
35
36
37
38
39
40
41
42
43
44
45
46
47
48
49
50
51
52
53
54
55
56
57
58
59
from dataclasses import dataclass
from typing import Optional
 
@dataclass
class PodRiskAssessment:
    pod:                    str
    namespace:             str
    anomaly_score:         float     # -1.0 to 0.0, more negative = more anomalous
    risk_level:            str       # "normal", "elevated", "high", "critical"
    restart_rate_per_hour: float
    trend:               str       # "stable", "increasing", "accelerating"
 
def assess_pod_risk(
    pod: str,
    namespace: str,
    recent_df: pd.DataFrame,
    models: dict
) -> Optional[PodRiskAssessment]:
 
    if pod not in models:
        return None
 
    scaler, model = models[pod]
    features      = compute_features(recent_df, pod)
 
    if features is None:
        return None
 
    features_scaled = scaler.transform(features)
    scores          = model.score_samples(features_scaled)
 
    # Use the most recent window's score
    latest_score = float(scores[-1])
 
    # Map score to risk level
    if   latest_score > -0.2: risk_level = "normal"
    elif latest_score > -0.4: risk_level = "elevated"
    elif latest_score > -0.6: risk_level = "high"
    else:                   risk_level = "critical"
 
    # Calculate restart rate
    pod_data     = recent_df[recent_df["pod"] == pod].sort_values("timestamp")
    restart_rate = pod_data["restart_count"].diff().sum()
    hours        = (pod_data["timestamp"].max() - pod_data["timestamp"].min()).seconds / 3600
    rate_per_hour = restart_rate / max(hours, 0.1)
 
    # Determine trend from acceleration feature
    last_acceleration = features[-3:, 1].mean()  # Average of last 15 min
 
    if   abs(last_acceleration) < 0.01: trend = "stable"
    elif last_acceleration > 0:        trend = "accelerating"
    else:                        trend = "increasing"
 
    return PodRiskAssessment(
        pod=pod,
        namespace=namespace,
        anomaly_score=latest_score,
        risk_level=risk_level,
        restart_rate_per_hour=rate_per_hour,
        trend=trend
    )
59 lines  ·  UTF-8 Powered by OpsWorker AI

Step 4 - Triggering investigation before the alert fires

When a pod hits "high" or "critical" risk level, you want to start an investigation immediately - not wait for the threshold alert to fire. The cleanest way to integrate with OpsWorker is to send a synthetic alert via the same Prometheus AlertManager webhook that OpsWorker already listens to.

This keeps your integration clean - OpsWorker receives a standard Alertmanager payload, runs its normal investigation workflow, and delivers root cause to Slack. The only difference is that the trigger is your anomaly detector rather than a threshold breach.

trigger_investigation.py
Python
1
2
3
4
5
6
7
8
9
10
11
12
13
14
15
16
17
18
19
20
21
22
23
24
25
26
27
28
29
30
31
32
33
34
35
36
37
38
39
40
41
42
43
44
45
46
47
48
49
50
51
52
53
54
55
56
57
58
59
60
61
62
63
64
65
66
67
68
69
70
71
72
73
import requests
import json
from datetime import datetime, timezone
 
ALERTMANAGER_WEBHOOK_URL = "https://your-opsworker-webhook-endpoint"
 
def trigger_predictive_investigation(assessment: PodRiskAssessment) -> bool:
    """
    Send a synthetic Alertmanager webhook to OpsWorker when anomaly
    detection flags a pod as high or critical risk.
    """
    if assessment.risk_level not in ("high", "critical"):
        return False
 
    # Format as a standard Alertmanager webhook payload
    alert_payload = {
        "version": "4",
        "groupKey": f"predictive/{assessment.namespace}/{assessment.pod}",
        "status": "firing",
        "receiver": "opsworker",
        "groupLabels": {
            "alertname": "PredictivePodInstability",
            "namespace": assessment.namespace
        },
        "commonLabels": {
            "alertname": "PredictivePodInstability",
            "namespace": assessment.namespace,
            "pod":       assessment.pod,
            "severity": assessment.risk_level,
            "source":   "predictive_model"
        },
        "commonAnnotations": {
            "summary": f"Predictive model flagged {assessment.pod} as {assessment.risk_level} risk",
            "description": (
                f"Pod {assessment.pod} in {assessment.namespace} is showing signs of instability "
                f"before a failure threshold has been crossed. "
                f"Anomaly score: {assessment.anomaly_score:.3f}. "
                f"Restart rate: {assessment.restart_rate_per_hour:.2f}/hr. "
                f"Trend: {assessment.trend}."
            ),
            "triggered_by":             "anomaly_detector",
            "anomaly_score":             str(assessment.anomaly_score),
            "restart_rate_per_hour": str(assessment.restart_rate_per_hour)
        },
        "alerts": [{
            "status": "firing",
            "labels": {
                "alertname": "PredictivePodInstability",
                "namespace": assessment.namespace,
                "pod":       assessment.pod,
                "severity": assessment.risk_level
            },
            "annotations": {
                "summary": f"Predictive instability detected for {assessment.pod}"
            },
            "startsAt": datetime.now(timezone.utc).isoformat(),
            "generatorURL": f"http://prometheus/graph?pod={assessment.pod}"
        }]
    }
 
    try:
        response = requests.post(
            ALERTMANAGER_WEBHOOK_URL,
            json=alert_payload,
            headers={"Content-Type": "application/json"},
            timeout=10
        )
        response.raise_for_status()
        return True
    except requests.RequestException as e:
        print(f"Failed to trigger investigation for {assessment.pod}: {e}")
        return False
73 lines  ·  UTF-8 Powered by OpsWorker AI

The annotation fields are worth paying attention to. OpsWorker uses the alert payload as context for its investigation - the more specific you are about what the anomaly detector observed (score, restart rate, trend), the richer the investigation context will be.

Step 5 - Putting it together as a scheduled job

The full loop runs as a Kubernetes CronJob every 10 minutes:

run_predictive_scan.py
Python
1
2
3
4
5
6
7
8
9
10
11
12
13
14
15
16
17
18
19
20
21
22
23
24
25
26
27
28
29
30
31
def run_predictive_scan(namespace: str, models: dict):
    print(f"[{datetime.utcnow().isoformat()}] Running predictive scan for namespace: {namespace}")
 
    # Fetch recent 2-hour window for scoring
    recent_df = fetch_restart_history(namespace, days=0.1)  # ~2.4 hours
    triggered = []
 
    for pod in recent_df["pod"].unique():
        assessment = assess_pod_risk(pod, namespace, recent_df, models)
        if assessment is None:
            continue
 
        print(f"  {pod}: {assessment.risk_level} (score={assessment.anomaly_score:.3f}, trend={assessment.trend})")
 
        if assessment.risk_level in ("high", "critical"):
            success = trigger_predictive_investigation(assessment)
            if success:
                triggered.append(pod)
                print(f"  → Triggered OpsWorker investigation for {pod}")
 
    if triggered:
        print(f"Investigations triggered for: {', '.join(triggered)}")
    else:
        print("No pods above risk threshold. No investigations triggered.")
 
 
if __name__ == "__main__":
    # On startup: fetch full history and train models
    print("Loading historical data and training anomaly detectors...")
    historical_df = fetch_restart_history(NAMESPACE, days=7)
    models = train_anomaly_detector(historical_df)
    print(f"Models trained for {len(models)} pods.")
 
    # Then run a scan immediately
    run_predictive_scan(NAMESPACE, models)
31 lines  ·  UTF-8 Powered by OpsWorker AI

In production, you'd persist the trained models (pickle or joblib to a PVC or S3 bucket) and retrain weekly rather than on every startup. The scan itself should run every 5-15 minutes - frequent enough to catch accelerating trends early, infrequent enough not to flood OpsWorker with duplicate investigations.

What OpsWorker does with a predictive alert

Technical Architecture Diagram

When OpsWorker receives a PredictivePodInstability alert, it runs the same investigation it would for any other alert type - topology discovery, log analysis, resource correlation, configuration review. The difference is timing.

A pod that's been restarting with increasing frequency but hasn't yet crossed a hard threshold is in a more debuggable state than one that's actively crashing. Logs are cleaner. Resource metrics show a gradual trend rather than a spike. Recent deployments or configuration changes are still clearly correlated in the timeline.

In practice, predictive investigations tend to surface a clearer root cause than post-failure investigations, because the signal-to-noise ratio in the data is better when the system is degrading rather than failed.

The investigation output arrives in Slack with the standard format - affected resources, root cause with confidence level, specific remediation steps. The summary will include the context from your annotation fields, making it clear this was a predictive trigger rather than a live incident.

Honest limitations of this approach

Model drift is real. Kubernetes environments change constantly - new deployments, scaling events, updated resource limits. A model trained seven days ago may have a miscalibrated baseline by the time it's scoring today's data. Weekly retraining is the minimum; daily is better for volatile clusters.

False positives are inevitable. Any anomaly detector with a 5% contamination threshold will flag roughly 5% of normal behavior as anomalous. In a cluster with 200 pods, that's 10 false-positive investigations per scan cycle if you're not careful. Add a deduplication layer - don't trigger a new investigation for a pod that already has an open one from the last 30 minutes.

Restart count is a lagging indicator. By the time restarts are accelerating, something has already started failing. Combining restart data with memory trend analysis (approaching the limit before crossing it) and error rate from application metrics gives you earlier signal.

This doesn't replace threshold alerting. Predictive analysis catches slow-burn failures. Sudden failures - a bad deployment, a dependent service going down - will still fire your threshold alerts first. These two approaches are complementary, not alternatives.

Where this fits in the broader incident management picture

The reactive investigation workflow - alert fires, OpsWorker investigates, root cause delivered to Slack - handles the majority of incidents well. Predictive analytics adds a proactive layer on top: a small percentage of failures are slow-building enough that early detection changes the outcome from incident-and-recovery to problem-identified-and-fixed-before-users-notice.

That's worth building for. Not because it replaces your existing tooling, but because the incidents it catches early are often the ones that would have been hardest to investigate after the fact.

The code in this post is a starting point, not a production system. If you build on it, instrument the false positive rate from the start - that metric will tell you more about how well your model is calibrated than any other signal.

Sources and further reading


The OpsWorker team is building automated Kubernetes investigation infrastructure. If you're implementing predictive alerting and want to talk through the architecture, reach out at opsworker.ai.