By Aram Hakobyan, Founder & CEO at OpsWorker | March 2026 | 10 min read
I'll tell you exactly how this post came to exist.
Three months ago I was on a call with an SRE lead at a fintech company. Good team, solid Kubernetes setup, Prometheus doing its job. He told me they'd spent two weeks building a "self-healing" system. I asked how it worked. He said: when a pod crashes more than three times, it automatically restarts the deployment.
I asked what happens when the deployment keeps crashing after the restart.
Long pause.
"It... restarts it again."
That's not self-healing. That's a restart loop with extra steps. And it's where most teams end up when they try to build this without thinking through the failure modes first.
"Self-healing" means different things to different people
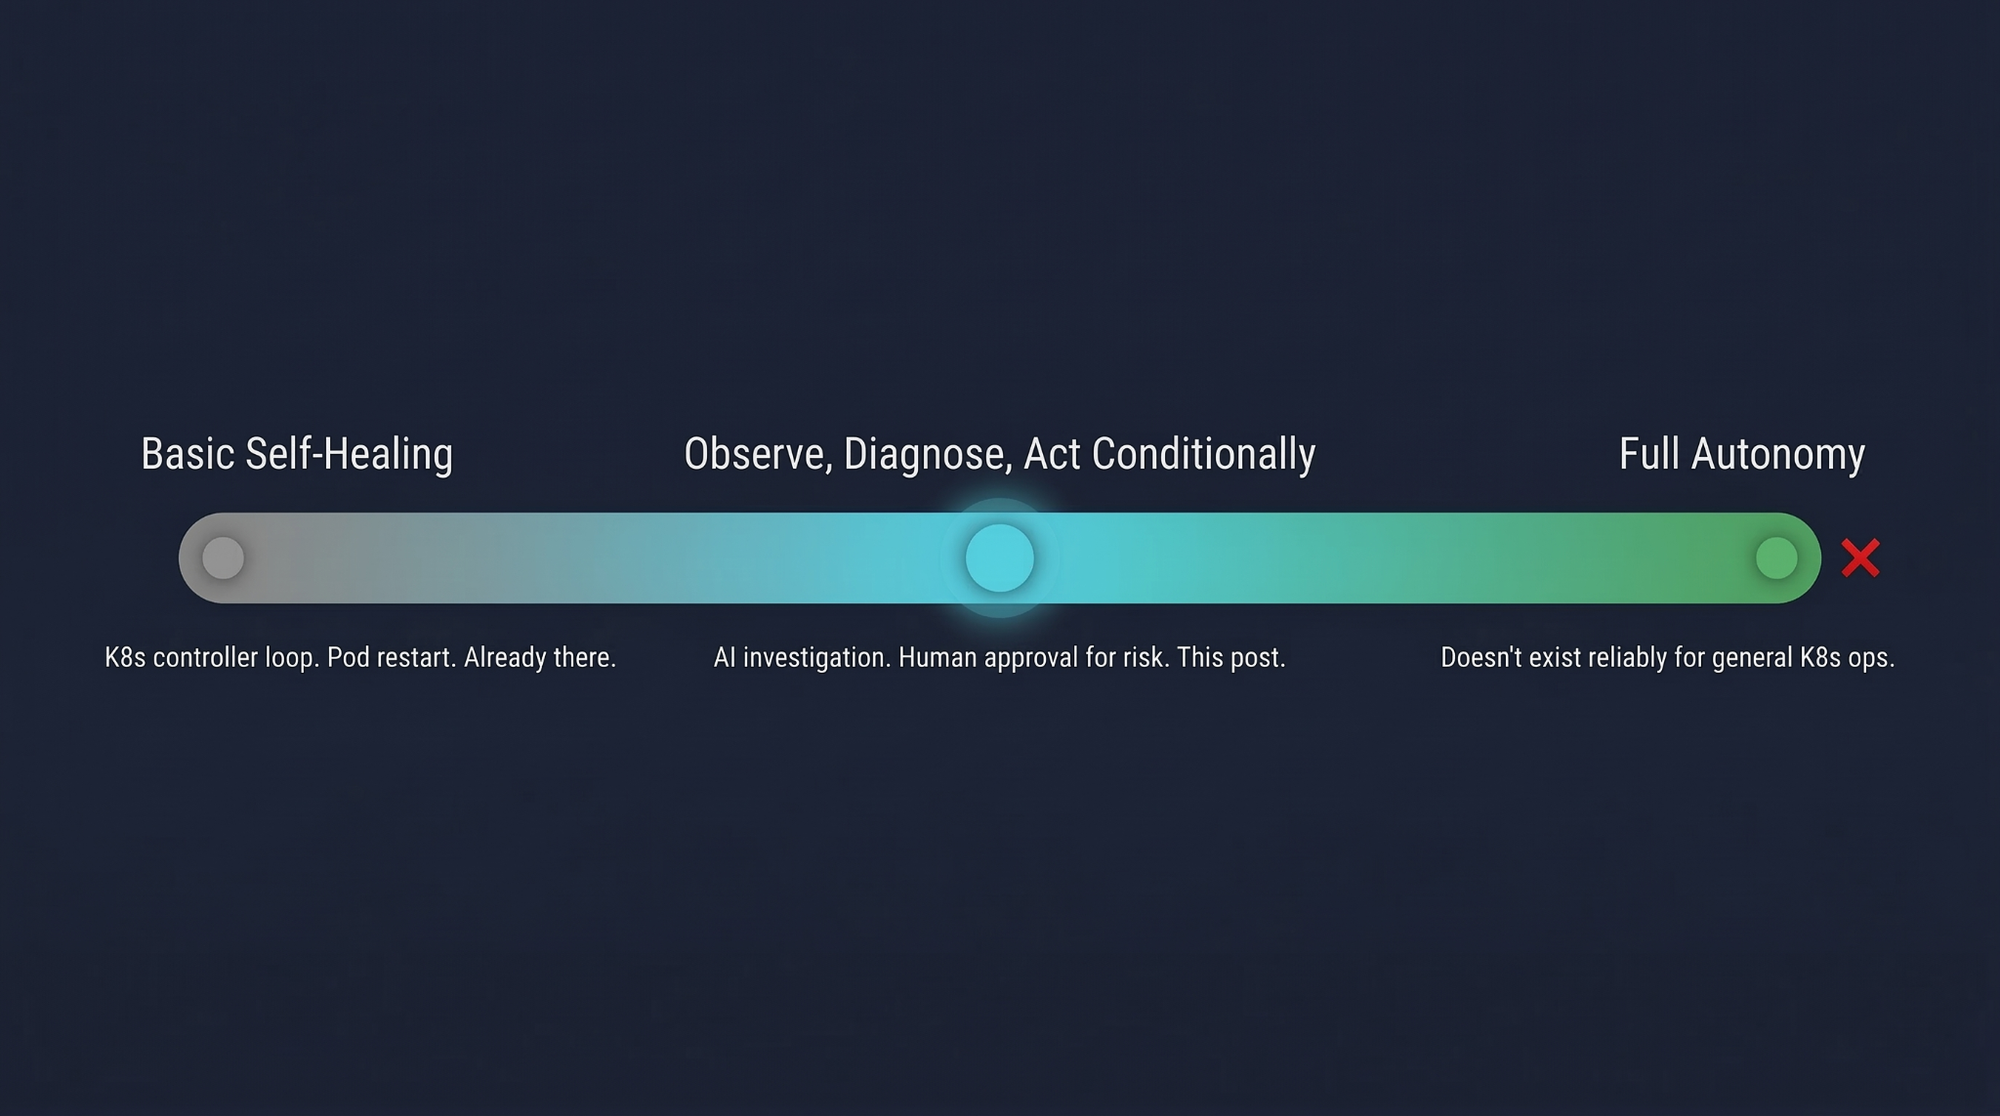
There's a spectrum, and most teams building in this space don't realize how far apart the ends are.
At one end: Kubernetes already self-heals. A Deployment replacing a failed pod is self-healing. That's the controller loop. It's been there since 2015 and it works fine for what it is.
At the other end: fully autonomous systems that detect, diagnose, remediate, and verify - no human in the loop at any point. These exist in narrow, well-understood domains. They don't exist reliably for general Kubernetes operations. Anyone telling you otherwise is selling something.
The interesting territory is the middle: observe, diagnose, act conditionally. Let AI handle the investigation. Let humans handle the consequential decisions. Automate the safe stuff, escalate everything else. That's the architecture this post covers - not because it's the most impressive answer, but because it's the one that actually works in production without eventually destroying someone's Friday night.

The architecture has four components. An event watcher that sees everything happening in the cluster. A classification layer that uses an LLM to decide what kind of problem it's looking at. An investigation trigger that hands off to OpsWorker for deep root cause analysis. And a remediation executor that acts on low-risk findings and escalates everything else for human approval.
Let me walk through each one honestly.
Component 1 - Watching cluster events
The foundation is reliable event observation. The Kubernetes Python client has a watch interface that streams cluster events in real time. In principle it's simple. In practice there are two things that every production implementation needs and most tutorials skip.
First: event noise filtering. Kubernetes events are extremely noisy. A single BackOff is almost always transient - pod scheduled on a struggling node, retried, moved on. If you trigger investigation on count=1 you'll be flooded within hours. We found that waiting for count >= 3 cuts the noise dramatically without missing real problems. Your cluster might want four. It almost certainly doesn't want one.
Second: reconnect logic. The watch stream times out. The connection drops. If your watcher doesn't handle this, it silently stops processing events and nothing tells you. I've seen this in production code at companies that absolutely should have known better.
The reasons worth watching: BackOff, Failed, OOMKilling, Evicted, FailedScheduling, FailedMount, Unhealthy, NetworkNotReady, NodeNotReady. Everything else is background noise for this use case.
One more thing: Kubernetes events expire after one hour by default and get dropped under API server pressure. If you're building anything serious on top of event watching, run Prometheus metrics as a parallel signal source. Events tell you what happened. Metrics tell you what's true right now.
Component 2 - Classification before action
Here's the mistake most self-healing implementations make. They go straight from "event detected" to "run remediation" with no diagnosis in between. CrashLoopBackOff = restart deployment. Every time.
This is wrong for a simple reason. A CrashLoopBackOff caused by an OOMKill needs a different fix than one caused by a bad environment variable. Restarting the deployment for an OOMKill buys you 90 seconds before it crashes again. You've added noise to your event stream and made the actual investigation harder.
You need a classification step before any action happens.
An LLM is genuinely useful here - not for root cause analysis, that comes later, but for categorizing events and deciding how to route them. The prompt asks the model to classify the event into a category (OOM kill, crash loop, scheduling failure, resource exhaustion, network issue, configuration error), assign a priority, estimate confidence, and - critically - flag whether the situation is safe for automated remediation.
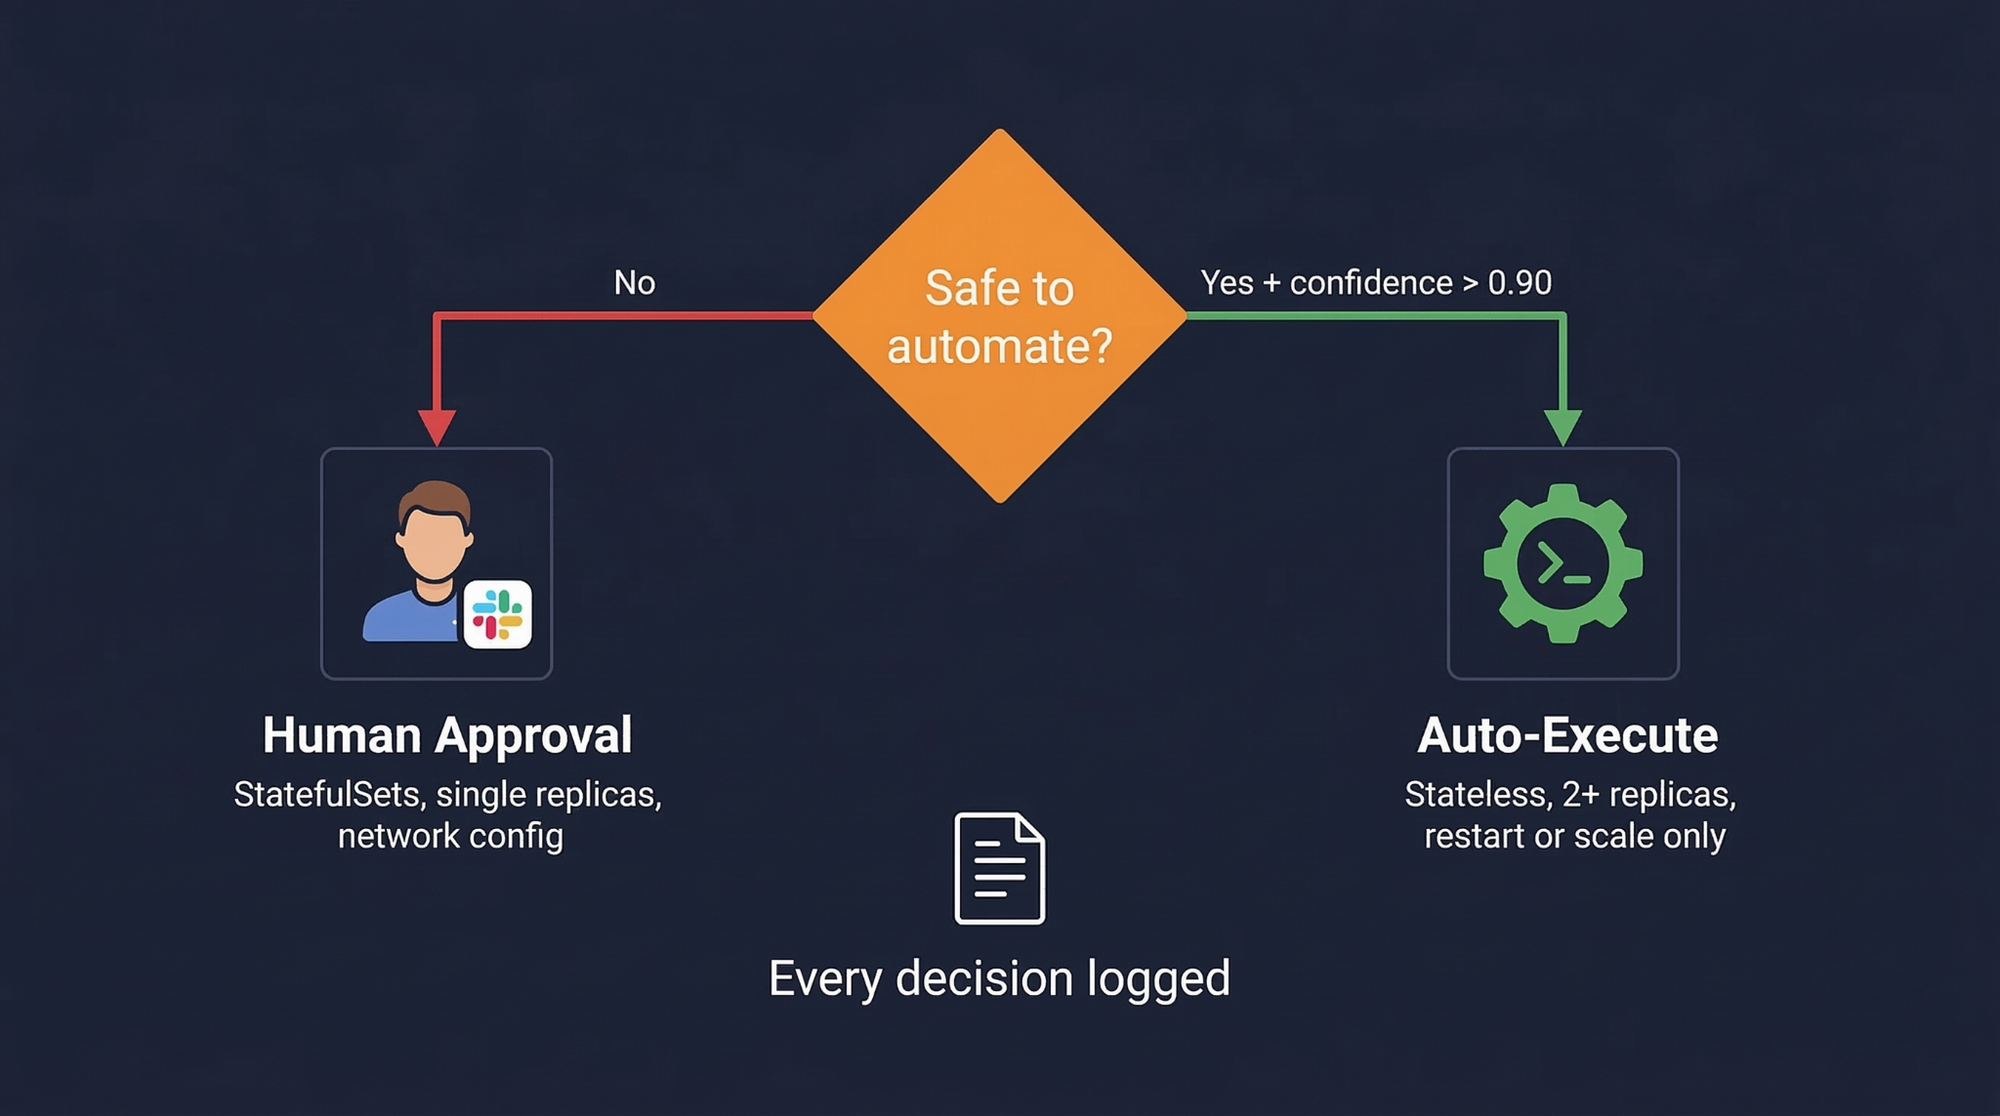
That last flag is where you encode your risk tolerance. My prompt instructs the model to mark safe_for_auto_remediation = true only for stateless deployments with more than two replicas where the fix is a restart or scale operation. Never for StatefulSets, DaemonSets, single-replica deployments, PVC operations, or anything touching network configuration.
If you think that's too conservative for your environment, adjust it. But adjust it deliberately, not because it seemed easier at the time.
Component 3 - Handing off to OpsWorker for real investigation
Classification tells you the category of problem you're probably looking at. It doesn't give you root cause. For that you need a full investigation - logs from every affected resource, topology mapping across pods and services and deployments, event correlation, configuration review.
That's what OpsWorker does. The agent triggers it via the standard Prometheus AlertManager webhook format, passing the classifier's findings as context so the investigation starts with what the agent already knows.
OpsWorker then runs topology discovery, pulls logs from every related resource, correlates signals across the affected system, identifies root cause with a confidence level, and delivers the full investigation to Slack - including the exact kubectl commands to resolve it. That investigation runs in parallel while the agent keeps watching for new events. By the time an engineer reads the Slack notification, the diagnostic work is already done.
The webhook payload is worth getting right. The commonAnnotations field is where OpsWorker picks up the agent's context - the classified category, confidence score, and recommended data points to check. The richer this is, the more targeted the investigation.
We built OpsWorker to be the investigation layer, deliberately not the remediation layer. There's a reason for that distinction. Investigation quality can be evaluated - you can read an investigation report and judge whether it's accurate. Automated remediation quality is much harder to evaluate until something goes wrong. Keeping the boundary clear means humans always review before anything changes.
Component 4 - The remediation executor, with real guardrails
Most tutorials that show auto-remediation are showing you a demo that would fail in real production within a week. The code looks clean. The demo works. The edge cases kill you.
The remediation executor in a system that actually works in production is gated. It doesn't just run actions. It checks confidence against a threshold (we use 0.90 for auto-execution), checks whether the action type requires human approval regardless of confidence, defaults to dry-run, and logs every decision with enough context to reconstruct exactly what happened and why.
High-risk actions - cordoning a node, updating resource limits - always require approval. No exceptions. The reasoning is straightforward: the blast radius of getting these wrong is too large to automate, regardless of how confident the classifier is.
The approval workflow is where most teams cut corners and where most production incidents with self-healing systems originate. "It logs to stdout and we check the logs" is not an approval workflow - it's a delay with extra steps. Build the Slack message with approve/reject buttons. Build the timeout that escalates to PagerDuty if no response in five minutes. Build the audit log. Build the mechanism to bulk-reject all pending actions if something goes seriously wrong. This is not glamorous work but it's what separates a useful system from a liability.
The dry_run=True default is a requirement, not a nice-to-have. If you're deploying this to production and you're not certain the flag is explicitly set to False, you're relying on a default to protect you. Defaults change. Someone updates a config. Log the dry-run state loudly on startup. Make it impossible to miss.
For OOMKill specifically: don't guess at the right memory limit. OpsWorker's investigation will have already landed in Slack with the actual memory usage trend and a specific recommended value. Use that. Queue the OOMKill remediation for approval, wait for the investigation report, apply the number it recommends.
The things that will break your logic anyway
Cascading failures don't have clean event signatures. When three services start failing simultaneously because a shared dependency is unhealthy, the event stream fires three separate events. Your agent opens three investigations. Your executor sees three potential remediations. OpsWorker will likely identify the common cause through topology discovery - but your executor has no idea it's looking at the same incident three times. Add deduplication keyed on time window and affected resource tree, not just resource name.
State management is underestimated in every architecture diagram and overestimated in every implementation timeline. The agent needs to track which events have triggered which investigations, which remediations are pending approval, what has been executed and when. Without this, a pod that keeps crashing triggers a new investigation every 10 minutes and your Slack channel becomes unreadable.
Slow-burn failures won't show up in events at all until they're already serious. A pod approaching its memory limit over four hours generates no events until it OOMKills. For these cases, combine event watching with the predictive analytics approach covered in our previous post - Prometheus metric trends catch the slow failures that events miss entirely.
A note on kgateway.dev
People ask about this since it's been getting attention in the Kubernetes space. kgateway (formerly Envoy Gateway with AI extensions) is an API gateway layer for routing requests to LLM providers - rate limiting, credential management, semantic caching, multi-provider routing. Useful infrastructure if you're running the classification layer at scale and want to avoid hardcoding API keys in agent deployments or getting rate-limited during an incident.
It's not core to the architecture. Get the agent logic right first. Add kgateway when you have a real operational reason for it, not because it's trending.
How to actually deploy this responsibly
Run dry-run for two weeks minimum. Not one day. Two weeks. In that time, manually execute every remediation the agent recommends and track whether the outcome was correct. That data tells you which categories are genuinely safe to automate and which need tighter guardrails. The answer will surprise you at least once.
Then expand the autonomy boundary by one category, verify for another week, repeat. Self-healing systems earn trust in one direction only: slowly, with evidence. Anyone promising you a shortcut through that process is not someone whose production cluster you want to be responsible for.
Aram Hakobyan is the Founder & CEO of OpsWorker, an AI-powered Kubernetes investigation platform that turns cluster alerts into root-cause analyses automatically. If you're building in this space and want to compare notes, reach out at opsworker.ai.
Subscribe to our email newsletter and unlock access to members-only content and exclusive updates.
Comments