By the OpsWorker team | March 2026 | 8 min read
It was 2:51 AM when the alert fired. CrashLoopBackOff on a payments service pod. The on-call engineer - one of our best - opened her terminal, started working through the usual checklist, and spent the next 47 minutes piecing together a story that, in the end, had a three-line fix.
The root cause wasn't in the pod. It wasn't even in the deployment. It was a ConfigMap that had been quietly updated six hours earlier as part of an unrelated database migration. The alert gave her a pod name. The problem lived somewhere else entirely.
That night is why we built OpsWorker. And it's also why building it turned out to be much harder than we expected.
The thing about experienced SREs
When a senior SRE investigates a Kubernetes alert, they're not running commands at random. They're executing a mental model built from hundreds of previous incidents. They know that a CrashLoopBackOff usually isn't a pod problem - it's a configuration, resource, or dependency problem that the pod is reporting. They know to look upstream. They know which resources to correlate. They know the questions to ask.
That mental model is the actual thing we needed to encode.
Most AI tools approach this problem by giving an engineer a better interface for asking questions. Chat with your cluster. Ask it what's wrong. The problem is that during an active incident - especially at 3 AM - you don't always know what questions to ask. The value of a senior SRE isn't that they're good at asking questions. It's that they already know what to check, in what order, and which signals matter.
Investigation is not a conversation. It's a systematic process of discovery. And that distinction turns out to be everything.
What the investigation workflow actually looks like
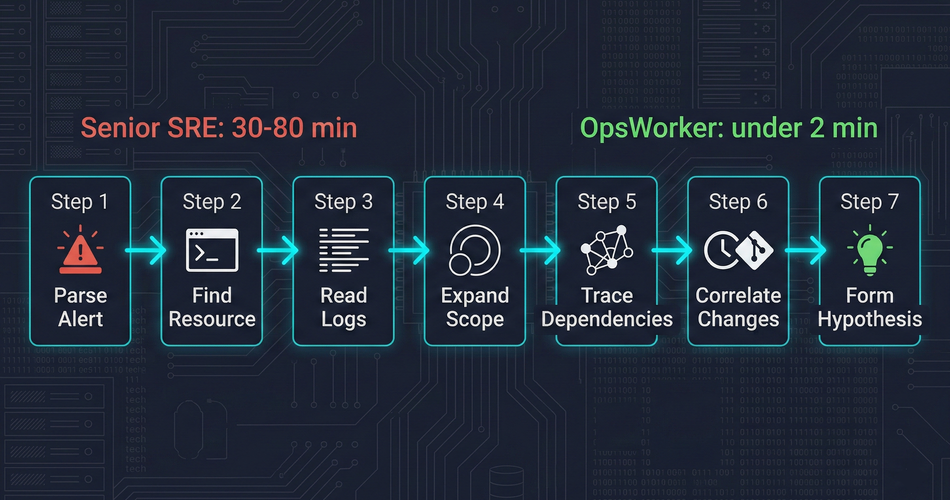
Before we could automate investigation, we had to understand it precisely. We spent months documenting what actually happens between "alert fires" and "root cause identified." The manual workflow, broken into honest steps, looks like this:
Step 1 - Parse the alert. What fired? Which resource? What does the alert payload tell you about scope and severity? This takes 30 seconds if the alert is well-structured. Longer if it isn't.
Step 2 - Find the affected resource. kubectl get pod -n <namespace>. Check status. Look at recent events. Confirm what you're looking at.
Step 3 - Read the logs. kubectl logs <pod> - current and previous container. Look for the error that caused the state. This is where the first dead ends happen. Logs tell you what crashed. Rarely why.
Step 4 - Expand the scope. Check the deployment. Check the replicaset. Check the node the pod is scheduled on. Is this isolated or part of a pattern?
Step 5 - Trace the dependencies. What services does this pod depend on? What does it expose? Is the problem in this resource, or is it reporting a problem that lives somewhere upstream?
Step 6 - Correlate with recent changes. What changed recently? Deployments, config changes, scaling events. The timing of the problem relative to changes is often the most important signal.
Step 7 - Form and test a hypothesis. Based on everything gathered, what is the most likely root cause? Is there a remediation step that confirms it?
This workflow takes a senior engineer 30 to 80 minutes. It takes a junior engineer longer, because they don't know which steps to prioritize and which dead ends to skip. It takes everyone longer at 3 AM.
The question we set out to answer: can we make a system that runs this workflow autonomously, without a human at the keyboard?
The topology problem
The hardest part isn't running kubectl commands. It's knowing which kubectl commands to run.
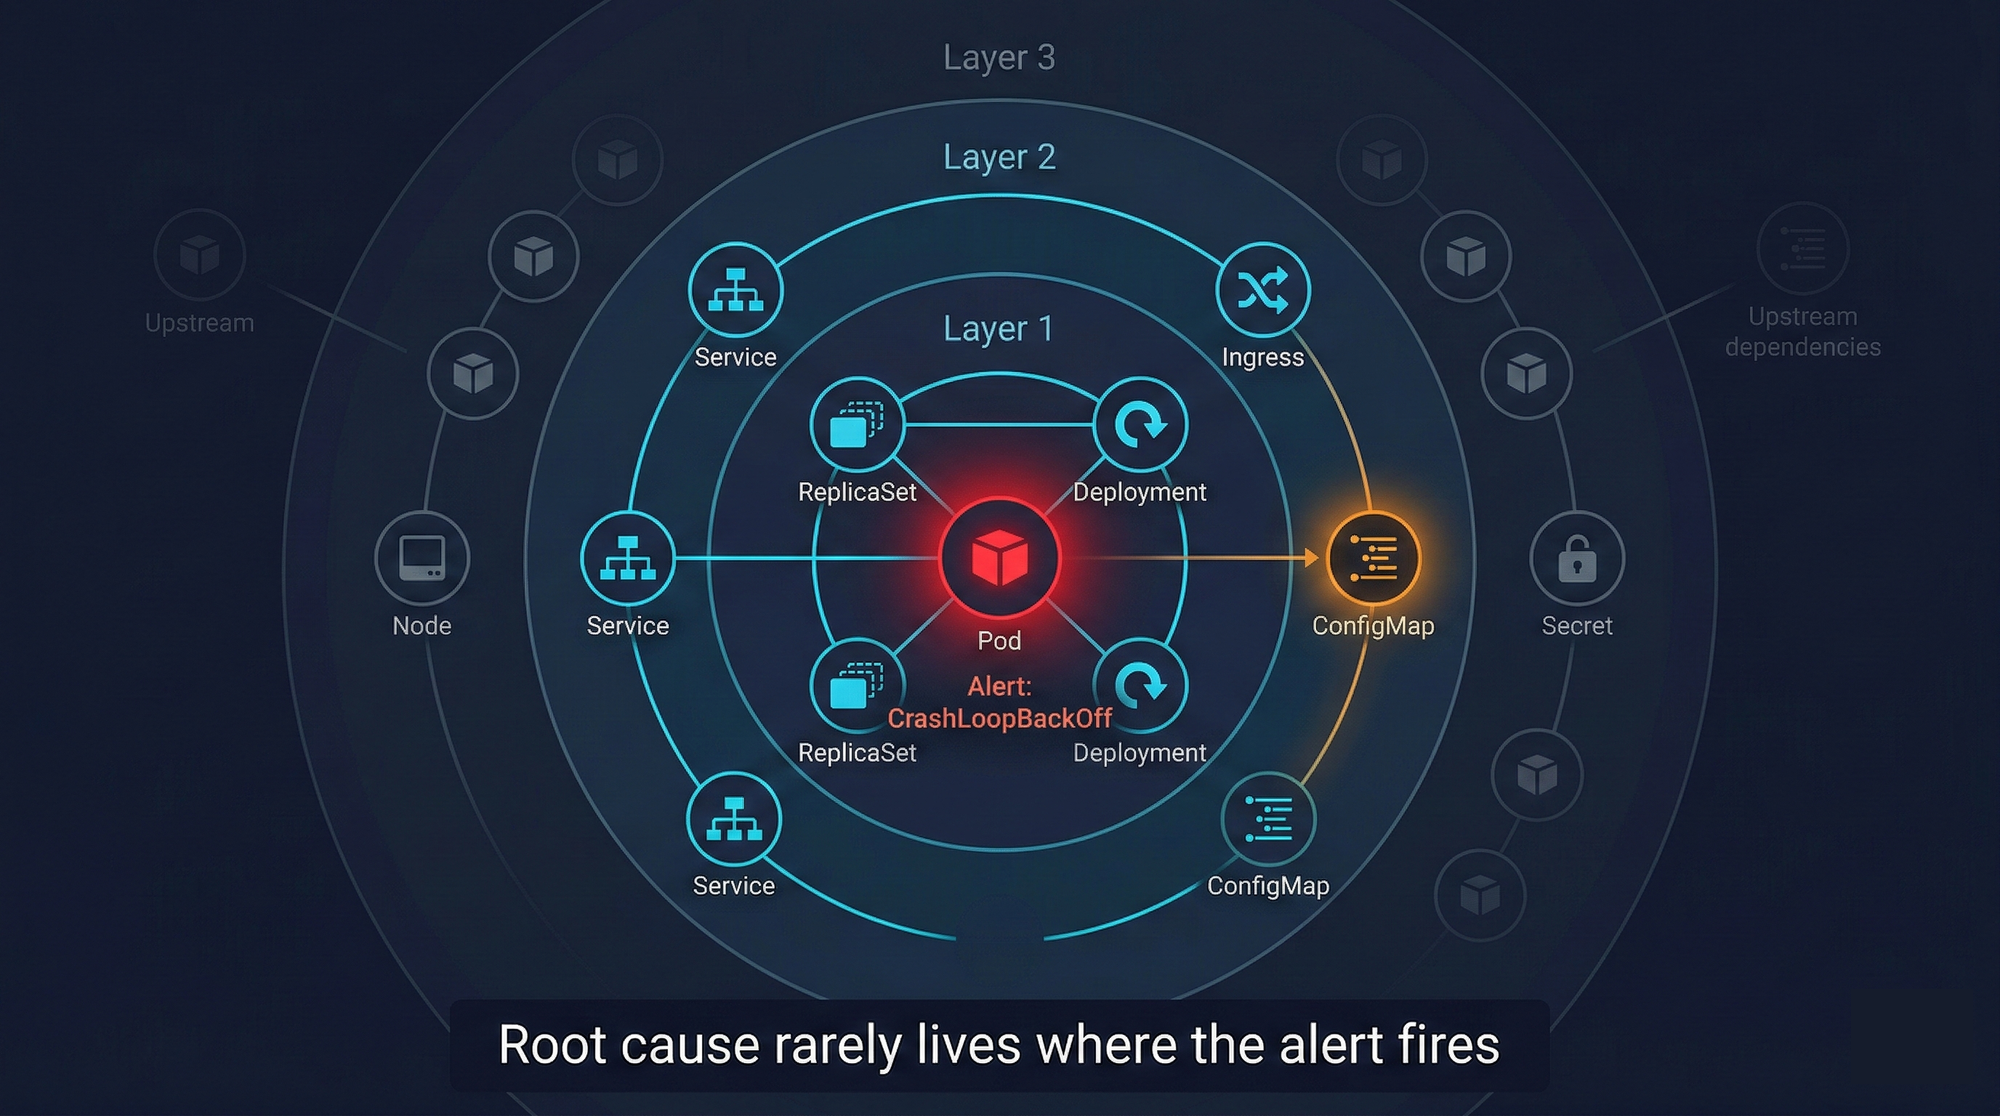
When an alert fires for a specific pod, the root cause is often in a different resource. We call this the topology problem: to investigate correctly, you need to understand the relationships between Kubernetes resources at runtime - and those relationships aren't static.
A pod belongs to a ReplicaSet, which belongs to a Deployment. But it also has a Service in front of it, which may have an Ingress, which may have its own TLS configuration. The pod reads from ConfigMaps and Secrets. It communicates with other services. Its behavior is shaped by resources that don't appear in the alert payload at all.
Manual investigation requires an engineer to trace this topology by hand - running commands, reading output, following references. For a senior engineer who knows the cluster, this is fast. For anyone else, or for an unfamiliar part of the cluster, it's slow and error-prone.
We needed a way to discover this topology automatically from a single starting point: the resource named in the alert.
Our approach works outward from the alerting resource, discovering related resources layer by layer. From a pod, we discover the owning ReplicaSet and Deployment, the Services that select it, the Ingress rules that route to those Services. We follow ConfigMap and Secret references. We check node-level context when it matters. The result is a complete picture of the affected topology - not just the resource that fired the alert, but the full ecosystem it lives in.
This matters because root causes follow topology. A CrashLoopBackOff on a pod is frequently a bad value in a ConfigMap. A service degradation is frequently a downstream dependency that hasn't been directly monitored. You cannot find these causes if you're only looking at the resource that triggered the alert.
The multi-resource investigation
Once we have the topology, we run a parallel investigation across every related resource.
For each resource, we gather the data a senior SRE would gather manually:
- Pod-level: container logs (current and previous), exit codes, resource utilization against limits, restart history, scheduling events
- Workload-level: deployment history, rollout status, replica counts, HPA state if present
- Configuration: ConfigMaps and Secrets referenced by the workload, recent changes if detectable
- Service and network: endpoint health, service selector matching, ingress configuration
- Cluster context: node pressure, recent events at the namespace level, any adjacent failures
The volume of data gathered per investigation is significant. A single CrashLoopBackOff investigation might pull data from fifteen or twenty distinct resources. The challenge isn't gathering the data - it's making sense of it.
This is where the AI component earns its place.
Why a single AI model isn't enough
When we first prototyped OpsWorker, we tried feeding all investigation data into a single model and asking it to identify the root cause. The results were inconsistent. For simple incidents, it worked well. For complex multi-resource failures, it would either miss the root cause or produce plausible-sounding but incorrect analyses.
The problem is that different stages of investigation require fundamentally different cognitive tasks.
Parsing and structuring log output is a pattern-matching task - fast, high-volume, not requiring deep reasoning. Identifying which ConfigMap value is causing a specific crash requires precise reasoning about the relationship between configuration and behavior. Generating a remediation plan requires synthesizing everything gathered and producing specific, actionable commands that account for the actual cluster state.
These tasks have different accuracy requirements and different acceptable latencies. Forcing a single model to handle all of them introduces tradeoffs that hurt the most important task: accurate root-cause identification.
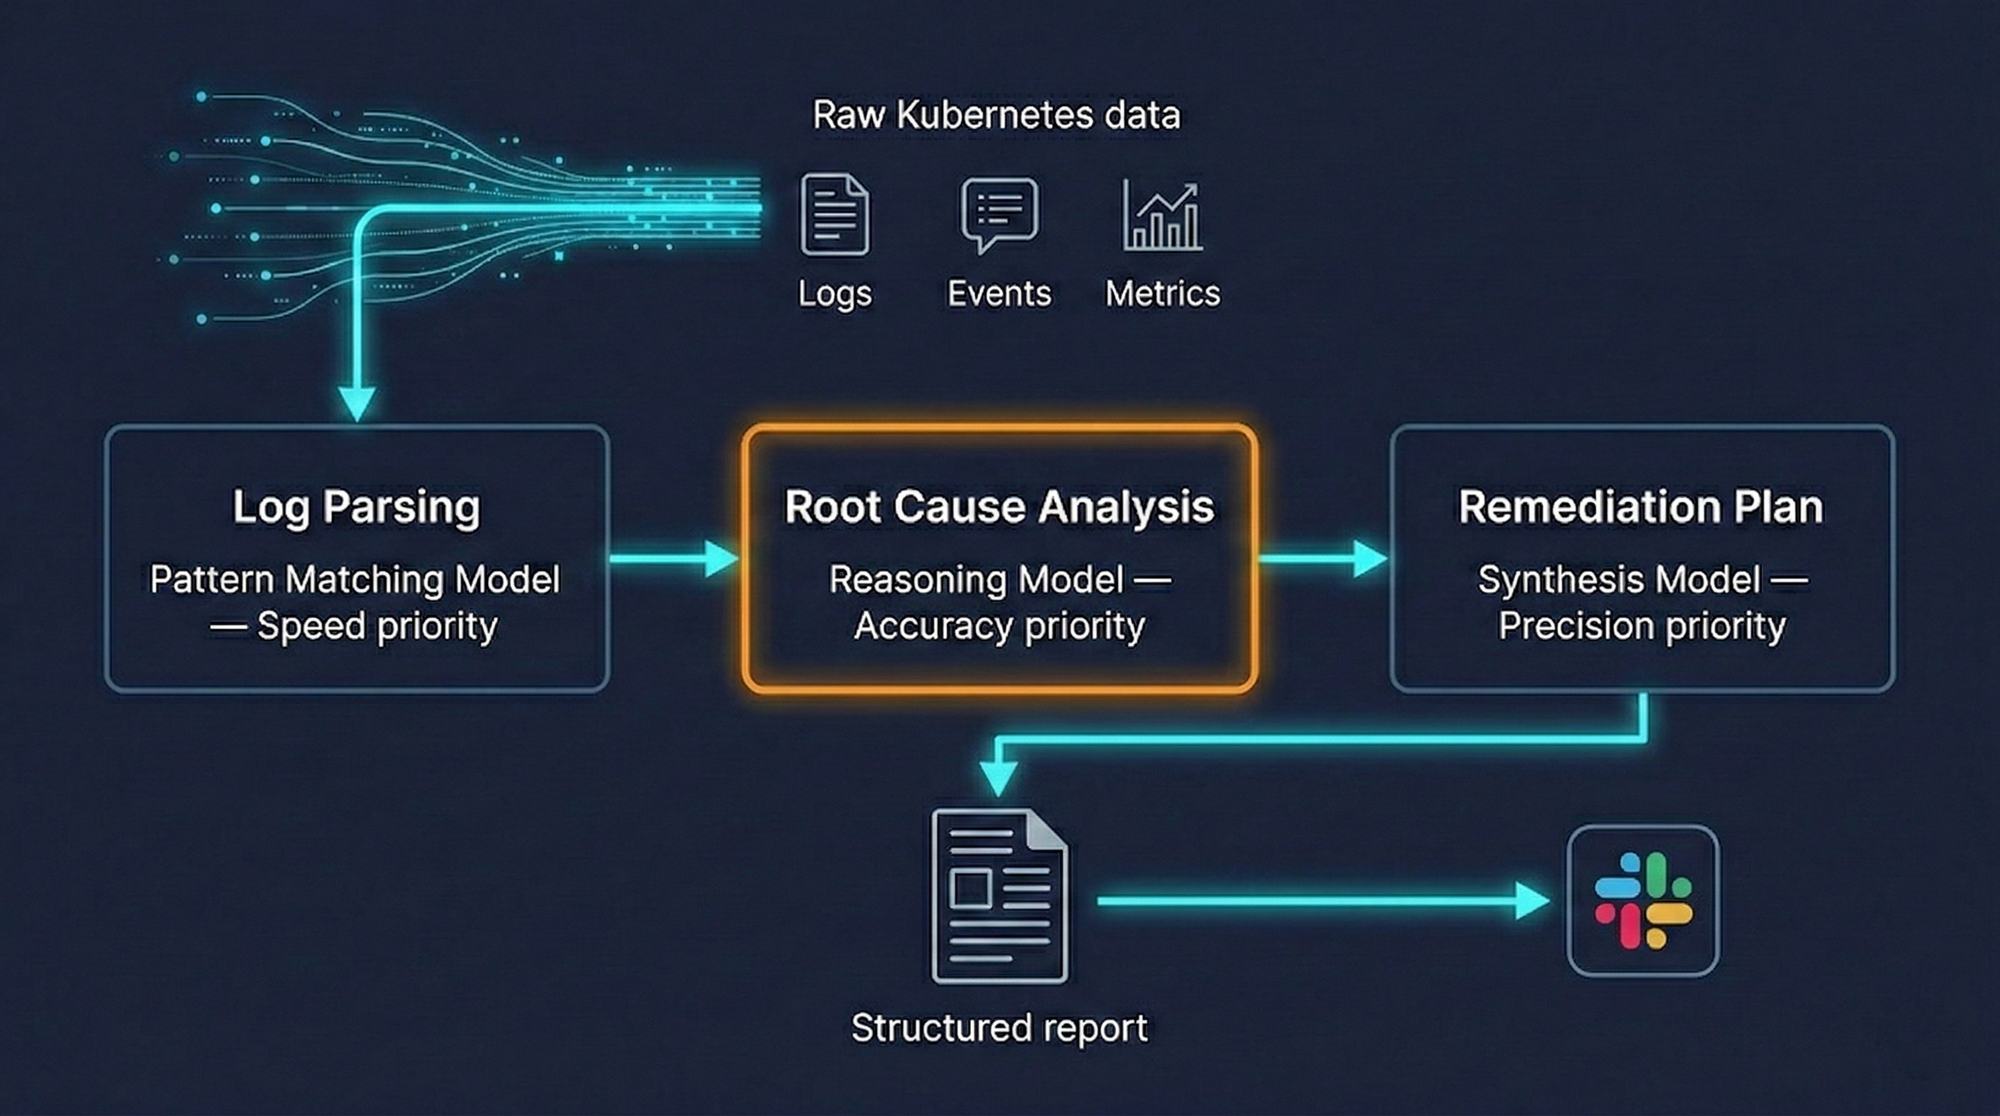
Our architecture uses different AI models for different stages of the investigation, routing each task to the model best suited for it. We're deliberately vague about the specifics here - model choices change as the field evolves, and what matters is the routing strategy, not the current model selection.
The result is better accuracy on the investigations that matter most, and faster processing on the tasks where speed is the primary requirement.
What an investigation produces
The output of an OpsWorker investigation is a structured report delivered to Slack before the on-call engineer has finished reading the alert.
A complete investigation report contains:
Affected resources identified - Not just the resource named in the alert, but the full list of related resources examined. This gives the engineer confidence that the investigation didn't miss something.
Root cause analysis - A specific explanation of what caused the incident, with a confidence level. The confidence level is important: we don't pretend certainty we don't have. A high-confidence root cause ("container exit code 137 - OOMKilled; memory limit of 256Mi exceeded by average usage of 312Mi over past 4 hours") is presented differently than a lower-confidence hypothesis ("likely cause: ConfigMap value DB_HOST points to decommissioned endpoint - verify with step 2 below").
Specific remediation steps - Not "check your resource limits." Not "review your configuration." Exact kubectl commands the engineer can review and execute. The specific commands, the specific resource names, the specific values to change.
Evidence trail - The data that supports the root cause conclusion: which logs were examined, which events were correlated, which configuration values were checked. The engineer can verify every step of the reasoning.
Here's what a remediation block looks like in practice:
- Pod container exited with code 137 (SIGKILL / OOMKilled)
- Memory limit: 256Mi | Peak observed usage: 318Mi (last 6h)
- 4 OOMKilled restarts in past 2 hours
kubectl patch deployment payments-api -n production \
-p '{"spec":{"template":{"spec":{"containers":[{"name":"payments-api","resources":{"limits":{"memory":"512Mi"}}}]}}}}'Verify current average usage before applying.
Consider HPA configuration if usage variance is high.
The engineer doesn't have to translate a diagnosis into action. The action is already there.
What we deliberately don't do
We get asked about auto-remediation regularly. The answer is no, and it's worth explaining why.
Automated investigation is a read-only process. We gather data, correlate signals, and produce analysis. No cluster state is modified at any point in the investigation. The agent running inside the customer's cluster operates in read-only mode - by design, not just by policy.
Auto-remediation is a fundamentally different category of system. It requires not just understanding what went wrong, but having enough confidence to change production state without human review. The failure modes are asymmetric: a wrong root-cause analysis produces a bad recommendation that an engineer catches before executing. A wrong auto-remediation executes something in production before anyone reviews it.
We think the right division of responsibility is: OpsWorker does the investigation, the engineer does the execution. The investigation is fast enough (under two minutes) that the human in the loop doesn't meaningfully add to MTTR. What it does add is accountability and a sanity check that we think production systems require.
OpsWorker also doesn't replace your monitoring stack. It doesn't ingest metrics, build dashboards, or alert on conditions. It receives alerts from the tools you already use - Prometheus, CloudWatch, Datadog - and investigates them. The distinction matters because it means there's no migration, no rip-and-replace, no week-long onboarding process. You add a webhook endpoint and OpsWorker starts working with your existing setup.
The feedback loop
A static investigation system would degrade over time. Kubernetes environments change, services evolve, new failure patterns emerge. An investigation that's accurate today might miss root causes that become common next month.
We built a feedback mechanism into every investigation result. Engineers can mark an investigation as accurate, partially accurate, or incorrect, and add context about what the actual root cause was. That feedback flows back into the system and influences how future investigations in the same environment are weighted.
This is one of the more technically interesting problems we've worked on: how do you incorporate signal from a sparse, qualitative feedback source into an investigation system that needs to improve continuously? We'll write more about this in a future post. For now: it works, it measurably improves investigation accuracy over time, and it means OpsWorker gets better the longer you use it.
Honest limitations
The system handles the most common Kubernetes failure patterns well: OOMKilled, CrashLoopBackOff, service degradation, ingress routing failures, resource exhaustion, configuration drift. These represent the majority of alert volume for most teams.
It handles novel or unusual failure patterns less well. When a root cause doesn't match any pattern the system has seen, the investigation produces a lower-confidence analysis that may be less actionable. In these cases, the investigation still surfaces the relevant data and evidence - it just doesn't always synthesize it into a definitive root cause.
It currently supports single-cluster environments. Multi-cluster investigation is on the roadmap; the topology discovery and data gathering components require significant extension to handle cross-cluster resource relationships correctly.
It doesn't know about things it can't see. If the root cause is in an external system - a third-party API, a database outside the cluster, a network dependency not visible from within Kubernetes - the investigation will correctly identify that the problem appears to originate outside the cluster, but can't investigate further.
Where this goes
Building a system that thinks like an SRE is an ongoing project, not a finished one. The investigation capabilities we've described here are the foundation. On top of that foundation, there are genuinely interesting problems left to solve: improving accuracy on novel failure modes, handling multi-cluster topologies, building richer feedback loops, and moving from investigation to pattern recognition across incident history.
If you're an SRE or platform engineer who's spent too many hours running kubectl describe at 3 AM, we'd genuinely like to talk to you. Not to sell you anything - to understand how your investigation workflow differs from the patterns we've built for, and whether there are gaps we should be closing.
The system we've built is good. It isn't complete. We think that honesty is worth more than a perfect product page.
Subscribe to our email newsletter and unlock access to members-only content and exclusive updates.
Comments